
Your trading server doesn’t clock off when you do. Close the Remote Desktop window, and it carries right on – strategies running, charts updating, data coming in, with nobody watching over it. ServerIQ is how you keep an eye on it anyway: live performance while you’re disconnected, and a record of what happened while you weren’t looking. In this article, we’re going to cover what ServerIQ tracks, how to find it in your ChartVPS Portal, and what you’re looking at once you get there.
Tip
What Is ServerIQ?
ServerIQ is the monitoring layer for your ChartVPS server. A small agent runs quietly on the server itself, keeping an eye on CPU, memory, disk space, network throughput and the processes you actually care about – then reports all of it back to your ChartVPS Portal, where you can see it laid out on a dashboard.
Two things make that worth having. The first is that you can look back and see what your server was doing at 9:31 this morning, rather than guessing. The second is that ServerIQ can email you when something crosses a line you’ve set – a disk quietly filling up, memory climbing through the session, or NinjaTrader closing itself while you’re away from the desk.
And here’s the part that matters most when you open a ticket: you and our friendly support team are looking at the same telemetry. That turns “my platform froze this morning” from a conversation into a diagnosis.
ServerIQ is available on Alpha, Gamma and Delta services at no extra cost. It shows up in your Portal once it’s attached to a service, so if you don’t see it on one of your servers yet, our team of humans can get that sorted for you.
Note
How to Find ServerIQ in Your Portal
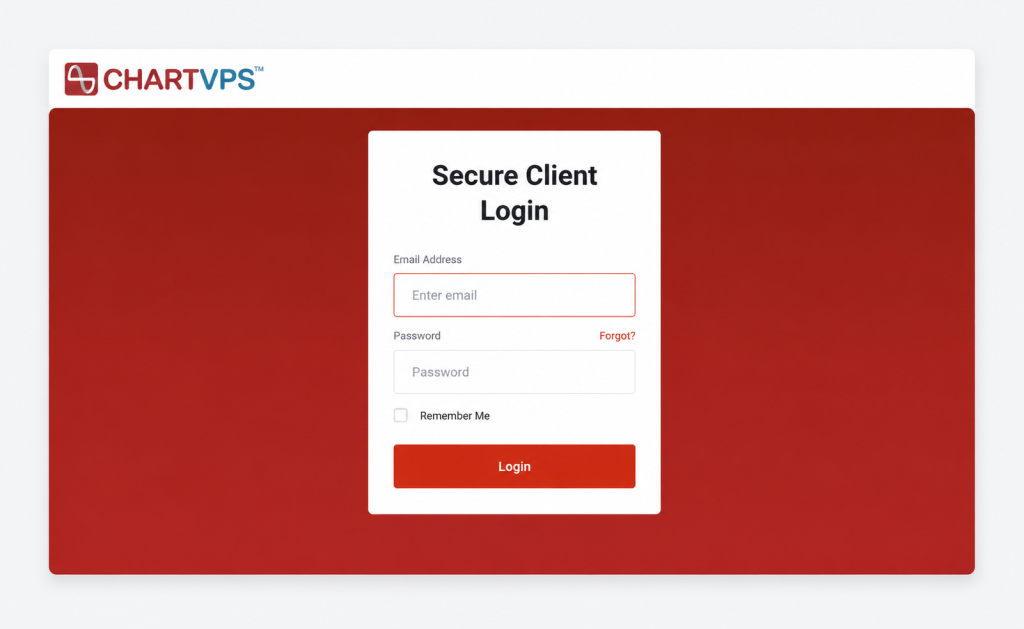
1First things first – log in to your ChartVPS Portal at portal.chartvps.com
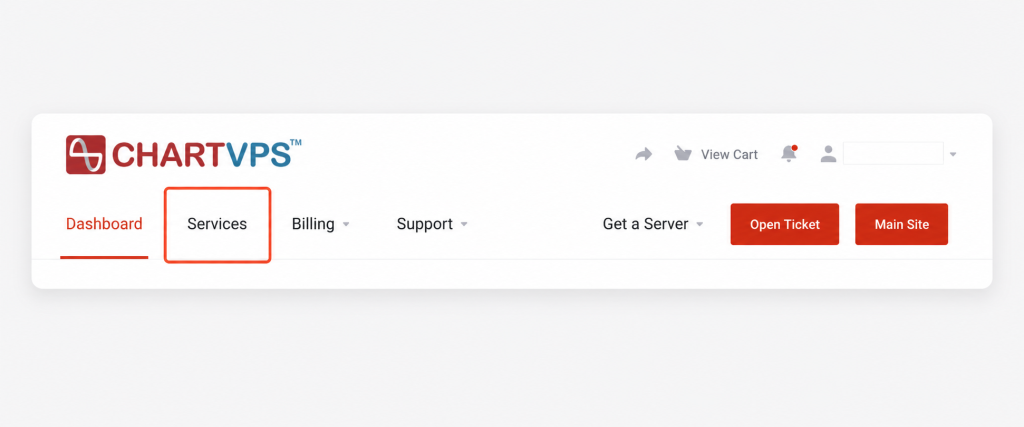
2Click Services in the top navigation. That’ll bring you to My Products & Services, which lists everything on your account.
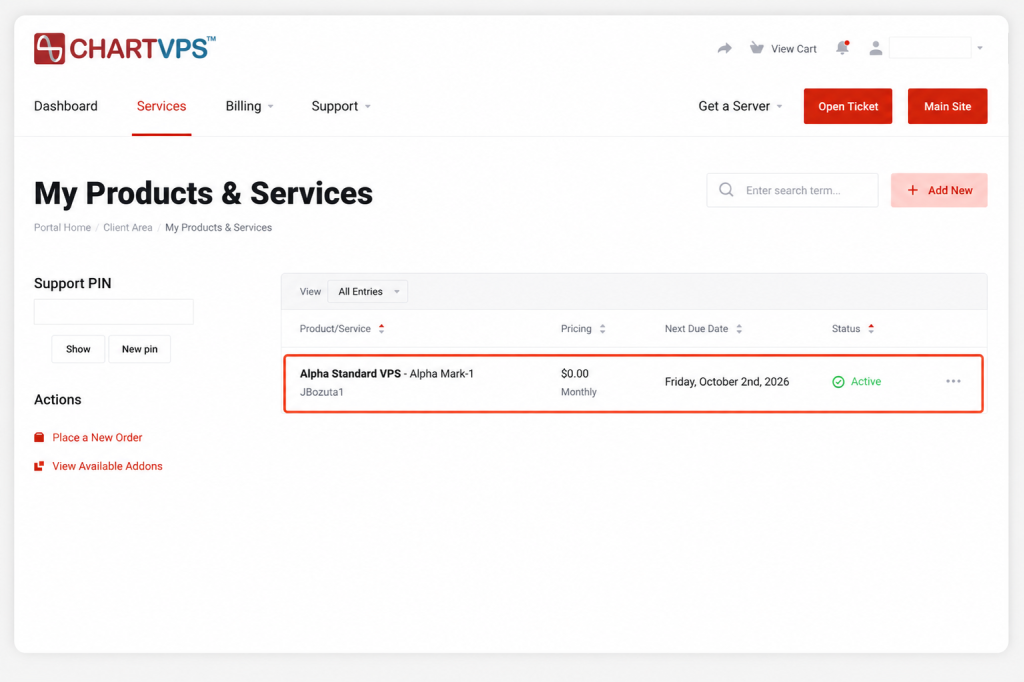
3Click the service you’d like to monitor. This takes you to that server’s Product Details page.
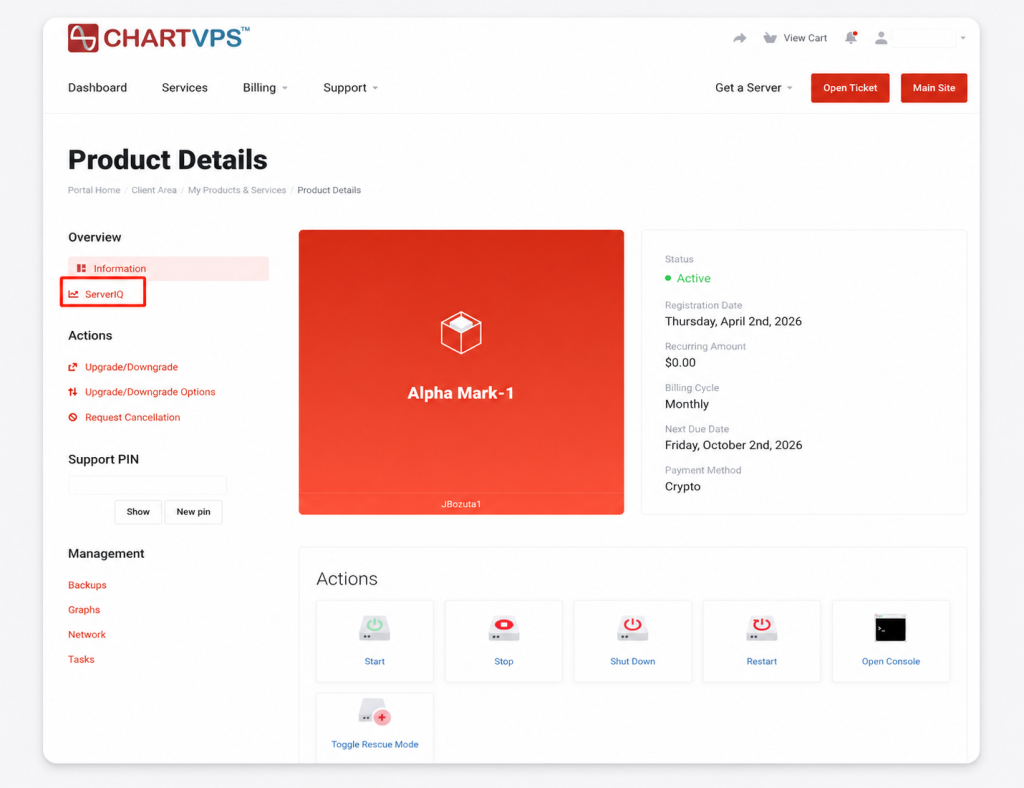
4Take a look at the left-hand sidebar. Under Overview, right below Information, you’ll find ServerIQ. Give it a click.
5And that’s it – you’re on the ServerIQ Monitoring page, looking at your server’s vital signs. Nice and easy!
ServerIQ lives under Overview, not under Management. It’s an easy one to miss, because Management is where Backups, Graphs, Network and Tasks live – so that’s the first place most people look.
Note
You’ll also spot a Graphs item under Management. That’s a different set of graphs, not the ServerIQ ones we’re covering here.
Tip
There’s more than one road to your server’s controls, by the way – we’ve got a whole article on How to Control the Server From the Portal if you’d like the tour.
Finding Your Way Around the Dashboard
Before we get into the individual tabs, here’s the furniture you’ll see on every one of them.
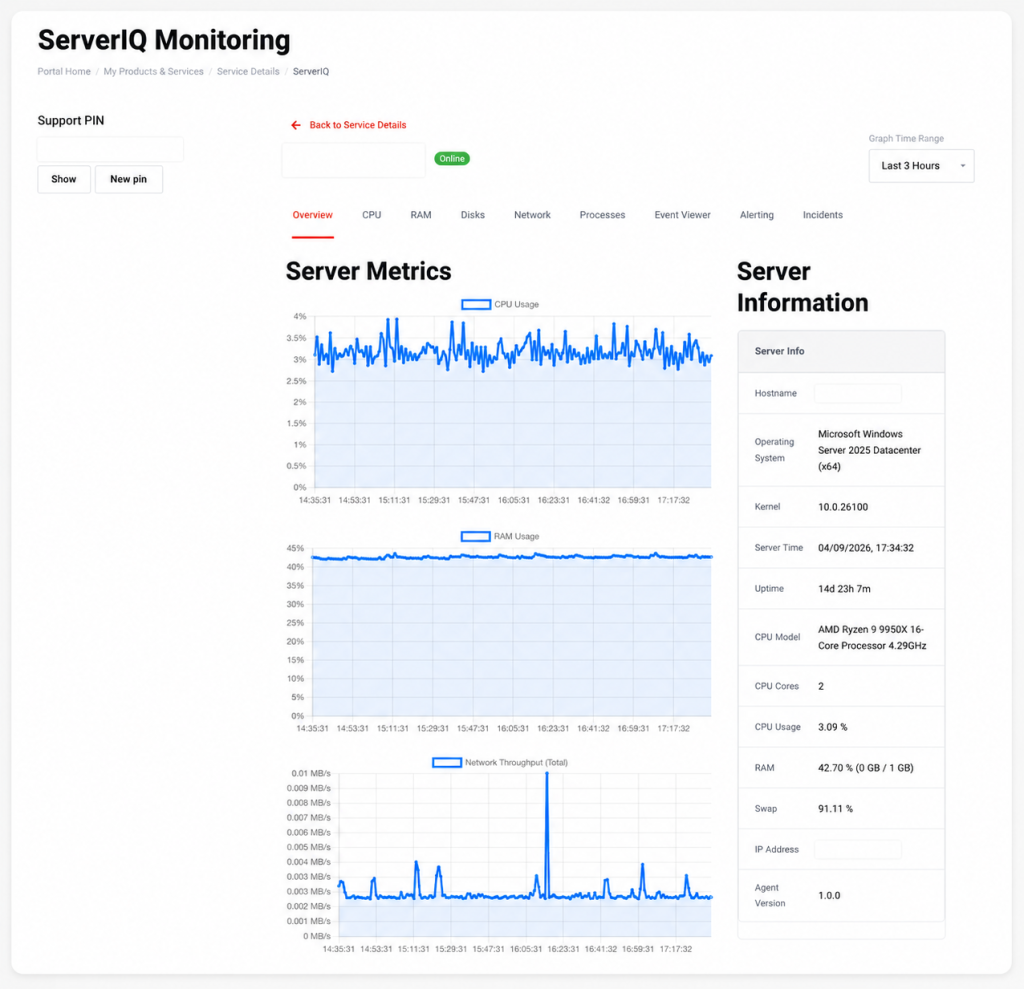
- At the top left, your server’s name with an Online badge next to it, and the server’s IP address just beneath.
- A ← Back to Service Details link, for hopping back where you came from.
- At the top right, the Graph Time Range selector. This controls how far back the graphs reach – anywhere from Last 5 Minutes to Last 7 Days, and it opens on Last 3 Hours by default.
- And running across the page, the nine tabs.
The Graph Time Range selector changes what the graphs show – but the Incidents tab keeps its own timeline and isn’t affected by it. If your range is set to Last 3 Hours and Incidents is showing you something from last Tuesday, that’s expected, not a glitch.
Note
The Nine Tabs at a Glance
- Overview – the summary view. CPU, memory and network throughput charts together, plus a Server Info panel listing your hostname, operating system, uptime and specifications.
- CPU – CPU usage over time, both as a whole and broken out core by core.
- RAM – memory and pagefile usage over time.
- Disks – how full your drives are, with a table of file systems and disks.
- Network – network throughput over time.
- Processes – a live list of everything running on your server, searchable and sortable by CPU or memory use.
- Event Viewer – recent Windows event log entries collected from your server.
- Alerting – where you create and manage the rules that decide when ServerIQ emails you.
- Incidents – the history of every time one of those rules was triggered, and whether it’s still ongoing.
We’ll walk through each of these tabs properly – what every graph is measuring and how to read it – in this article, How to Read Your ServerIQ Dashboard
Tip
Not finding what you’re looking for? Get in touch with our highly experienced support team – we’re around 24/7.
Tip