
Alerts is one of the most important ServerIQ features, where it watches on your behalf and emails you when something you care about happens – a platform closing itself, a disk filling up, a server going quiet. In this article, we’re going to set up the alert most traders want first, walk through the rest of the options, and flag the two mistakes that quietly stop alerts from being useful.
Tip
If you haven’t found the dashboard yet, start with What Is ServerIQ and How Do You Access It?
What ServerIQ Can Alert You About
Everything lives on the Alerting tab. There are five kinds of rule you can create:
- Service/Process Not Running – a named program has stopped. This is the one for your trading platform.
- CPU Usage % – processor load crosses a level you set.
- RAM Usage % – memory use crosses a level you set.
- Disk Usage % (Aggregated) – your storage crosses a level you set.
- No Data – the server has stopped reporting to ServerIQ altogether.
The Alerts You Already Have
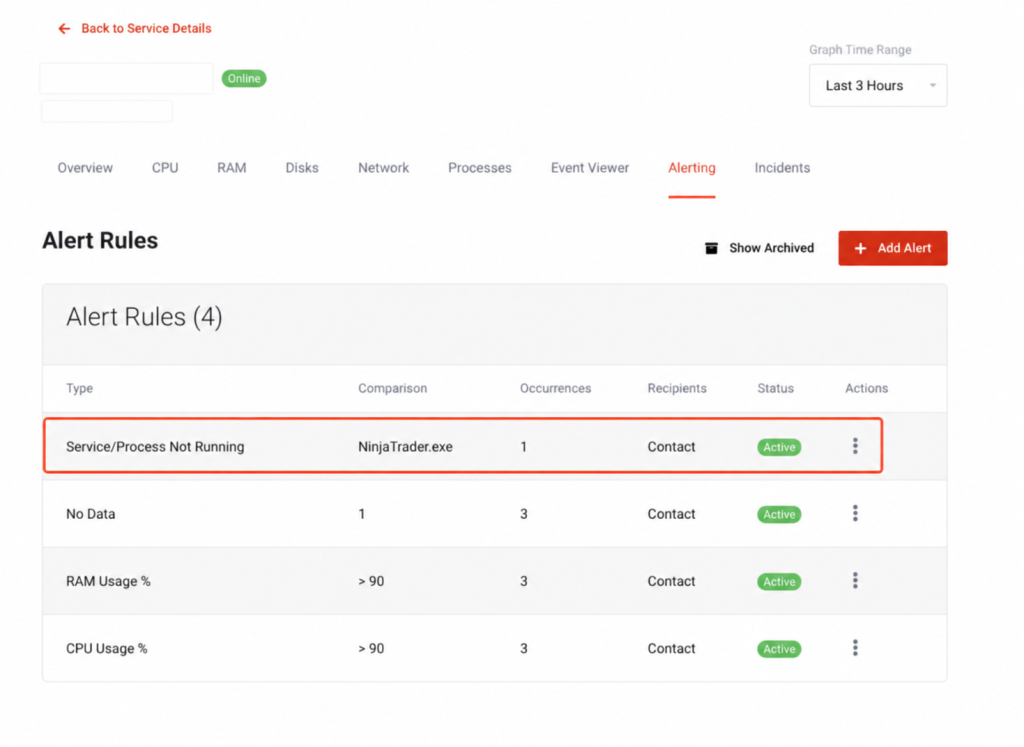
You don’t start from nothing. Every server arrives with three rules already active, which you’ll see listed under Alert Rules:
- No Data
- RAM Usage % greater than 90
- CPU Usage % greater than 90
Each row shows you the rule Type, the Comparison it’s testing, its Occurrences setting, who it notifies under Recipients, and whether it’s Active.
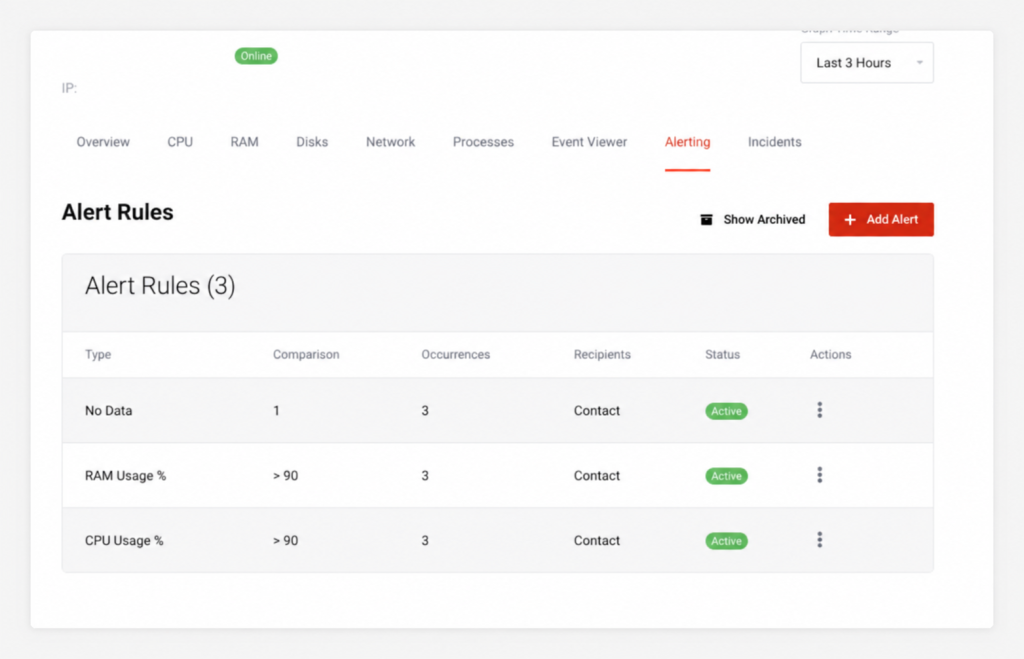
These three are a sensible floor, not a finished setup. They’ll tell you when your server is in trouble as a whole – but they’ve got no idea which programs matter to you. That’s the gap we’re about to close.
Note
Setting Up an Alert for Your Trading Platform
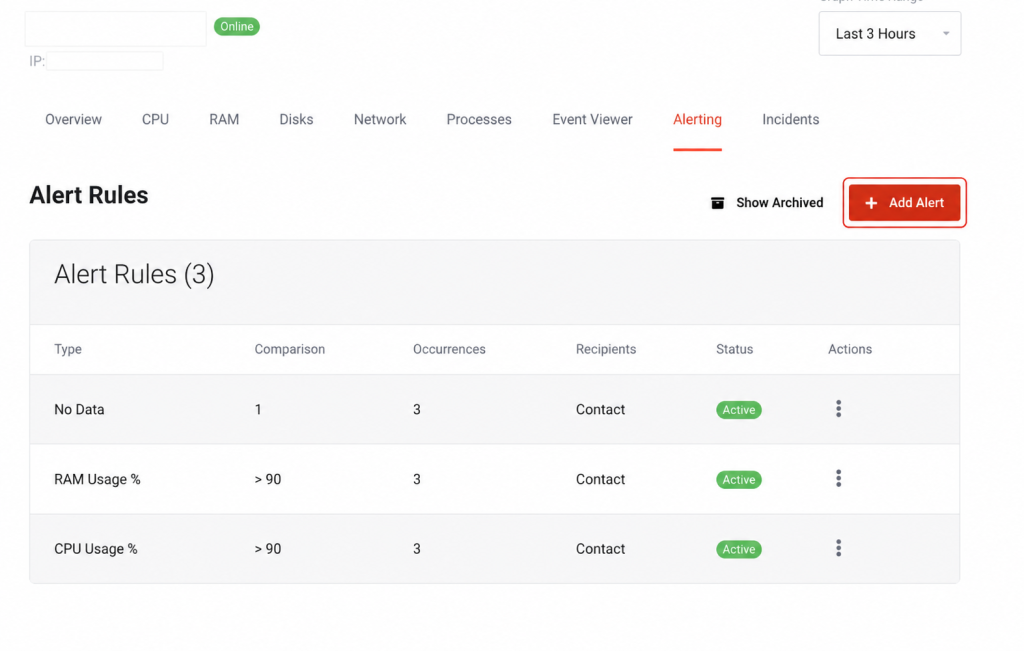
1Head to the Alerting tab and click the red + Add Alert button in the top right.
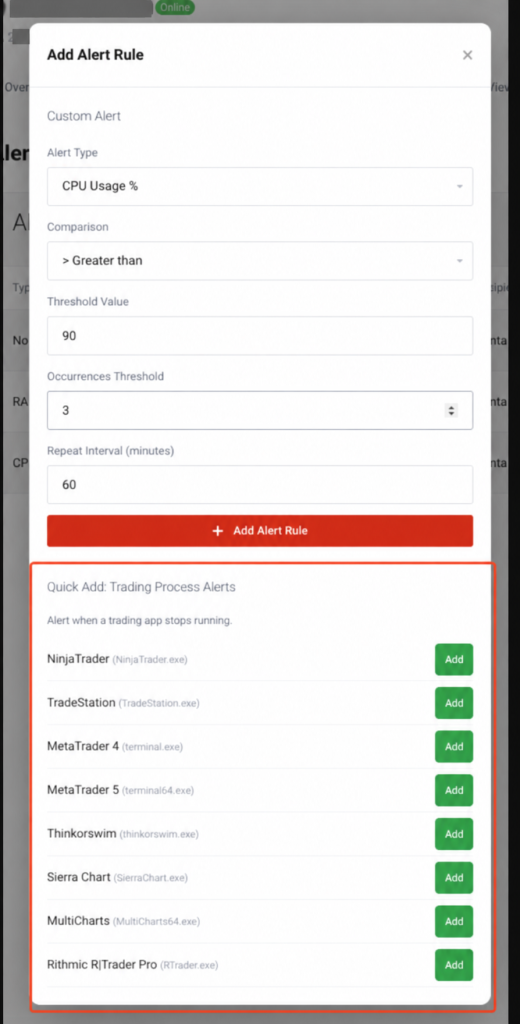
2In the panel that opens, scroll past Custom Alert to Quick Add: Trading Process Alerts. You’ll find one-click buttons for eight platforms:
- NinjaTrader
- TradeStation
- MetaTrader 4
- MetaTrader 5
- Thinkorswim
- Sierra Chart
- MultiCharts
- Rithmic R|Trader Pro
3Find yours and hit Add. The button turns into a green ✓ Active label, a confirmation pops up, and your new rule appears at the top of the Alert Rules table.
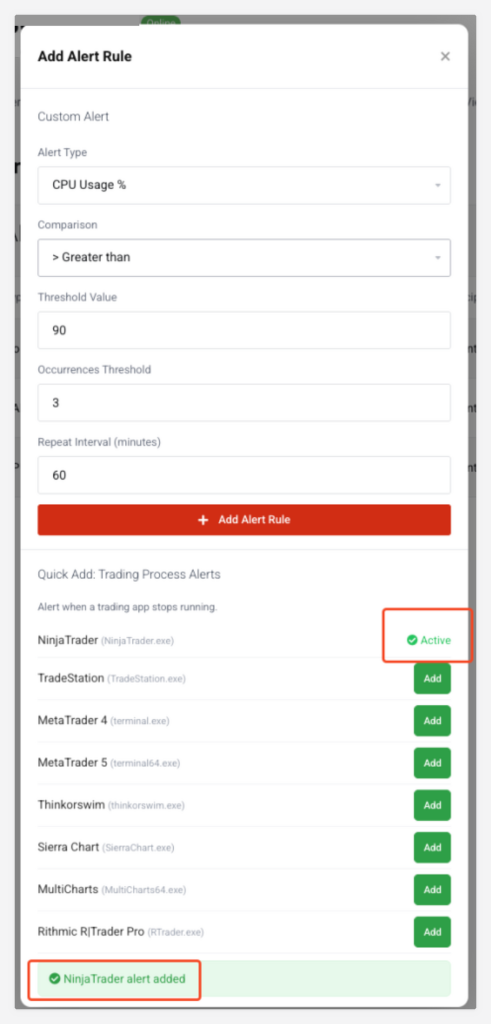
That’s it – ServerIQ is now watching that platform, and you’ll hear about it if it stops. Not bad for one click!
A note on the App alert. A Quick Add rule fires the moment your platform isn’t running – and it keeps reminding you at a set interval for as long as that stays true. Close NinjaTrader for the weekend and the emails will keep arriving right through it. This can quickly become frustrating.
The fix is simple: before any planned downtime, open the rule’s, menu and choose Archive. It stops without being lost, and you can bring it back from Show Archived when you’re trading again.
Warning
If Your Platform Isn’t in the List
Not every platform has a Quick Add button, but you can watch any program you like.
1Click + Add Alert, and in the Custom Alert section set Alert Type to Service/Process Not Running.
2Type the program’s process name into Process Name.
3Set the Occurrences Threshold and Repeat Interval, then save.
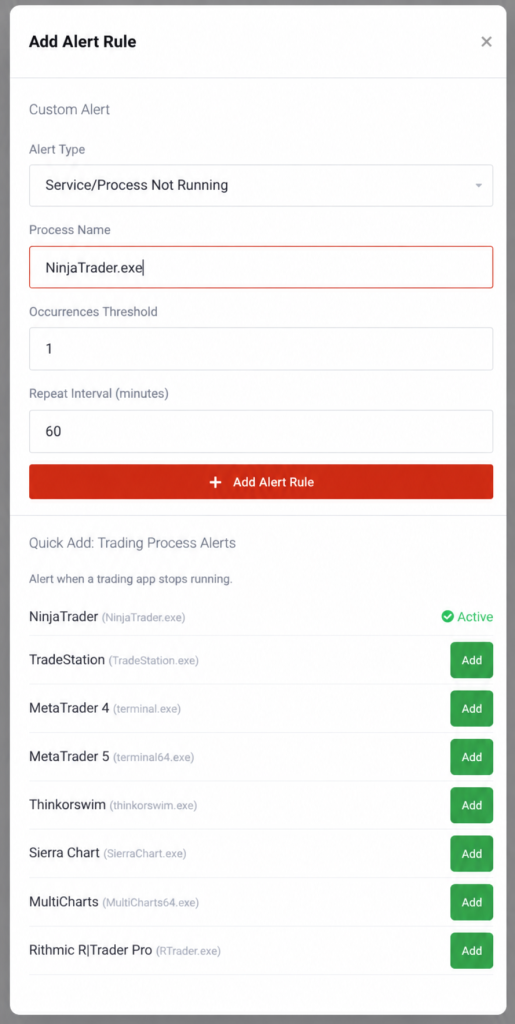
Get the name exactly right, because nothing will tell you if you don’t. There’s no spellcheck on that field. Type
NinjaTradr.exeand ServerIQ will faithfully watch for a program that doesn’t exist, decide it isn’t running, and alert you about it forever.Have no fear, though – there’s an easy way to be sure. Pop over to the Processes tab while the program is open, find it in the list, and copy the name across exactly as it appears there. That’s the name ServerIQ is matching against.
Warning
Setting Up a CPU, RAM or Disk Alert
Threshold rules work a little differently – instead of watching for something to disappear, they watch a number and tell you when it crosses a line.
1Click + Add Alert and choose CPU Usage %, RAM Usage % or Disk Usage % (Aggregated) from the Alert Type dropdown.
2Pick a Comparison. There are six available: greater than, greater or equal, less than, less or equal, equals, and not equal.
3Enter your Threshold Value – the number the comparison is measured against.
4Set Occurrences Threshold and Repeat Interval, then save your rule.
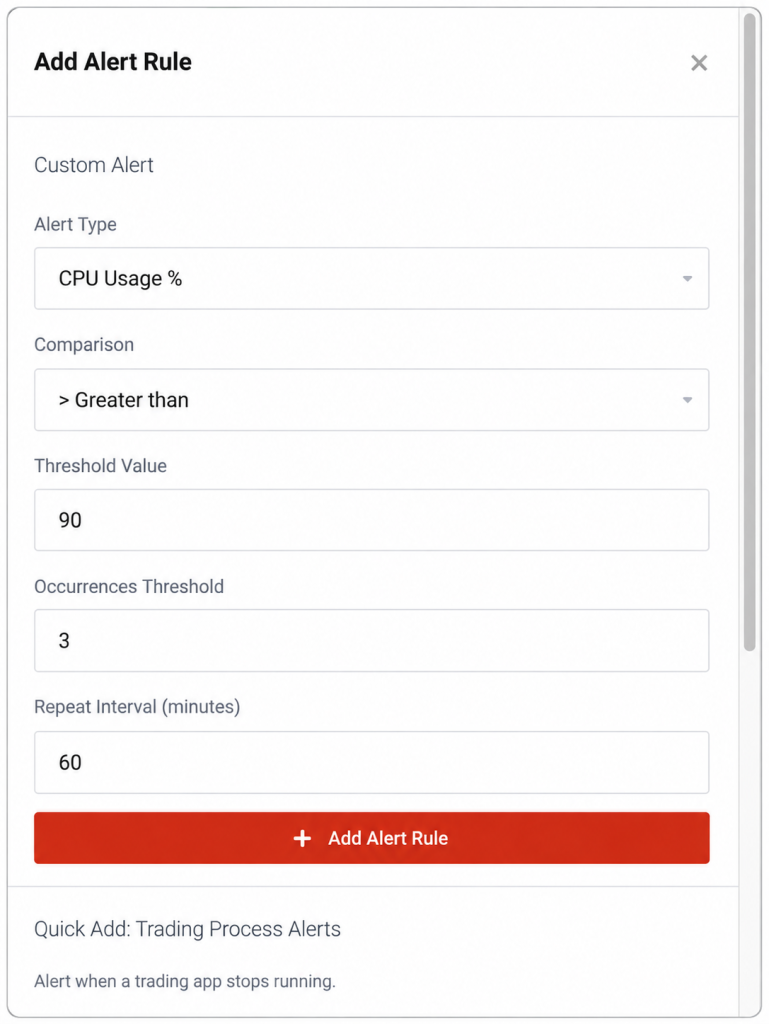
Expect the CPU alert to go off while you’re working. A backtest, a strategy optimisation or a big data backfill will pin your processor for a while quite legitimately, that’s your server doing exactly what you bought it for. If the default rule at 90% is interrupting your normal routine, raise the threshold or the Occurrences Threshold rather than switching it off. An alert you’ve tuned is worth far more than one you’ve deleted.
Note
A word on Occurrences Threshold. This is how many times the condition has to be seen before ServerIQ emails you, and it’s your main defence against noise. A low number means you hear about brief spikes; a higher one means only sustained problems reach your inbox, at the cost of hearing about them slightly later. If you’re being pestered by alerts that resolve themselves, this is the dial to turn.
Editing, Archiving and Deleting Rules
Every rule has a ⋮ menu at the end of its row with three choices: Edit, Archive and Delete.
Edit lets you change a rule’s settings – its comparison, its threshold, how many occurrences it needs, how often it repeats. One thing it won’t let you change is the Type: that field is locked once a rule exists. If you need a rule to watch something different, create a new one.
Archive takes a rule out of service without throwing it away, and archived rules can be found again under Show Archived. Delete is permanent. When in doubt, archive.
If you delete a rule and build a replacement, take a moment to check the Repeat Interval on the new one. The value the form offers you by default isn’t necessarily the value your original rule was using, and it’s an easy difference to miss.
Tip
Where Your Alerts Are Sent
The Recipients column on each rule reads Contact – alerts go to the contact details held on your ChartVPS account. If you’d like them going somewhere else, or to more than one place, have a word with our friendly support team and they’ll point you in the right direction.
Incidents: the Record of What Fired
The Incidents tab is the history that goes with your rules. Every time one of them is triggered, an incident is opened here, and it tells you which kind of rule fired, when it started, and whether it’s finished.
An incident showing Open in red, with Ongoing where its end time should be, is happening right now. One showing Resolved in green has an end time and is done with, the condition cleared on its own. The newest sit at the top.
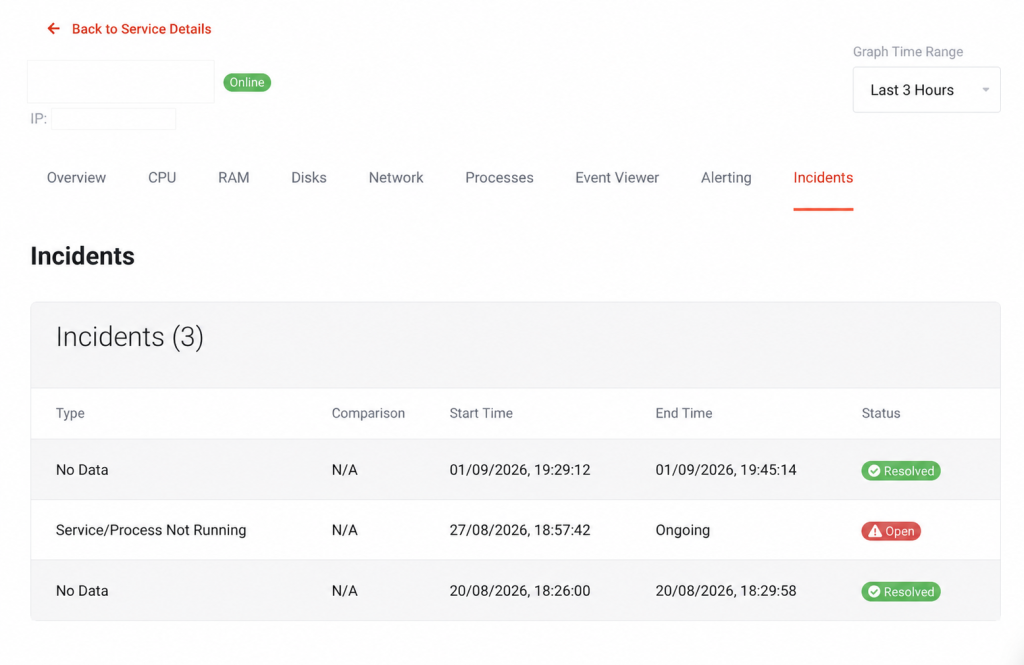
Incidents keeps its own timeline and ignores the Graph Time Range selector at the top of the page. Don’t be surprised to see last week’s incidents listed while your graphs are set to the last three hours; the tab is showing you everything it has.
Note
A quick note if the Incidents tab is busier than you’d expect: an alert rule that was set up for a program you no longer run will sit permanently open, because the condition never stops being true. Archiving that rule closes the loop.
Tip
Where to Go From Here
If you’d like to understand the numbers your threshold alerts are watching, How to Read Your ServerIQ Dashboard goes through every tab and graph on the dashboard.
Not finding what you’re looking for? Get in touch with our highly experienced support team, we’re around 24/7. Checking on a live issue? Take a look at our current system status.
Tip