


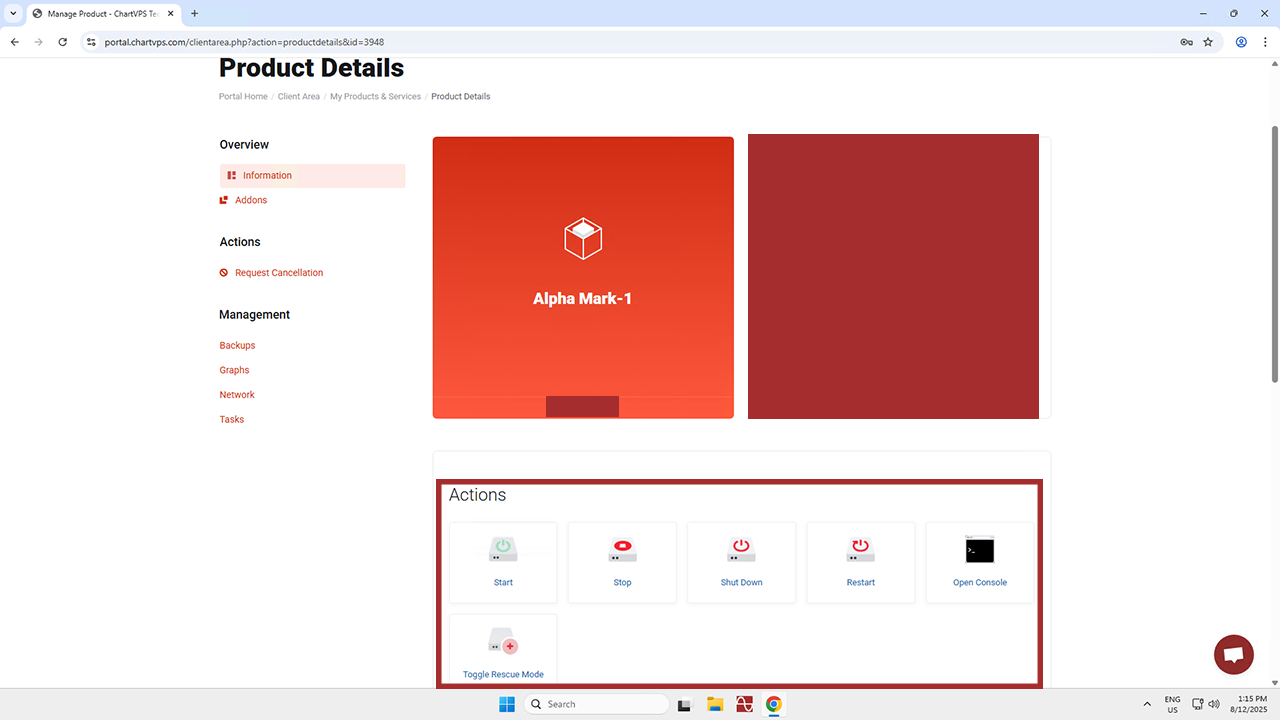
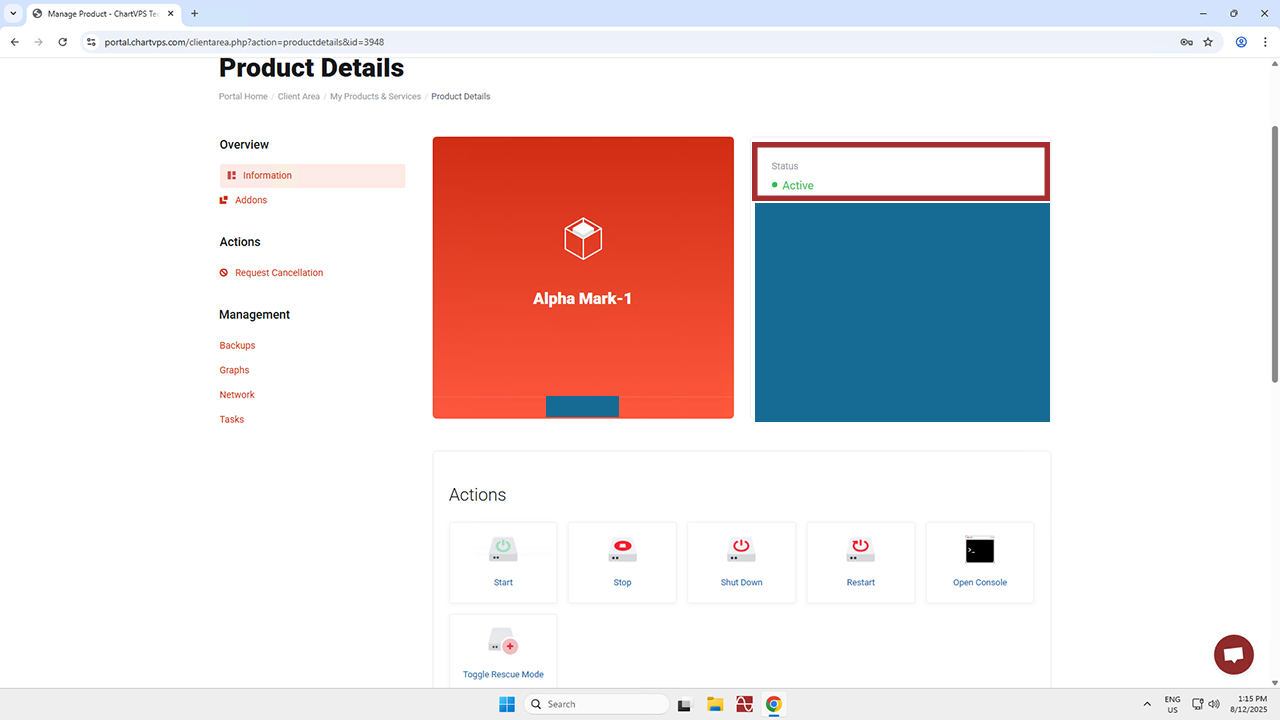
Actions
-
Start – Essentially, this is the process of initiating or launching the virtual server. It’s worth noting that your server has been started by default, so this function is only really needed if you stop the server or shut it down. When you start a VPS, you’re basically turning on the virtual machine, thus allowing it to run and become accessible over the network. "Starting" a VPS is the process of powering on and initializing the virtual server, so that it becomes operational and ready to do whatever you need it to!
-
Stop and Shut Down – These processes do the same thing — they shut down the virtual server instance. When you stop a VPS, you essentially turn off the virtual machine, stopping its operations and freeing up its resources. It’s like shutting down a physical computer! Important to remember, though, is that stopping a VPS will result in temporary downtime, since the server is turned off. This means that if you need the VPS to be accessible again, you’ll need to "Start" it, which involves booting up the virtual machine so it can resume operations. Note that shutting down the server doesn’t stop or pause your subscription, as our hardware resources will stay dedicated to your server.
-
Restart – As you might have guessed, this is similar to restarting a physical computer. It’s a process where the VPS briefly shuts down, then starts right up again. Rebooting a VPS helps refresh the system, clear out any temporary issues (like a corrupt cache or unresponsive processes), and ensure that all software and services are running smoothly. When asked a technical question, you may have heard someone reply with, “Have you tried turning it off and on again?” This is because rebooting is a common troubleshooting step to fix minor software glitches or to apply updates that require a restart. It’s worth noting that during a reboot, there’s a temporary period when the server is unavailable. This lasts until the startup process is complete, but don’t worry – it’s under 10 seconds for a VPS and only 3 minutes for a dedicated server.
-
Open Console – When it comes to a VPS, the console refers to a feature that provides direct access to the server’s operating system through a web interface. It’s like a remote terminal or command line interface that lets you interact with the VPS as if you were physically in front of it. The console is especially useful in situations where you can’t access the VPS through traditional remote methods (like Remote Desktop or Secure Shell) because of network configuration issues or other problems.
-
Toggle Rescue Mode – Rescue Mode can be an especially useful feature if one is looking to troubleshoot, recover, or repair their server, though it’s a function that’s most suited to advanced users. System Rescue is essentially a version of Linux that boots instead of the server’s usual operating system and can be used to recover some types of wiped data. Given that it can be a pretty complicated process, we recommend that anyone uncomfortable with it instead reach out to our friendly support team, as they’re around 24/7 to help you out with any and all server issues!
Additional Tools
-
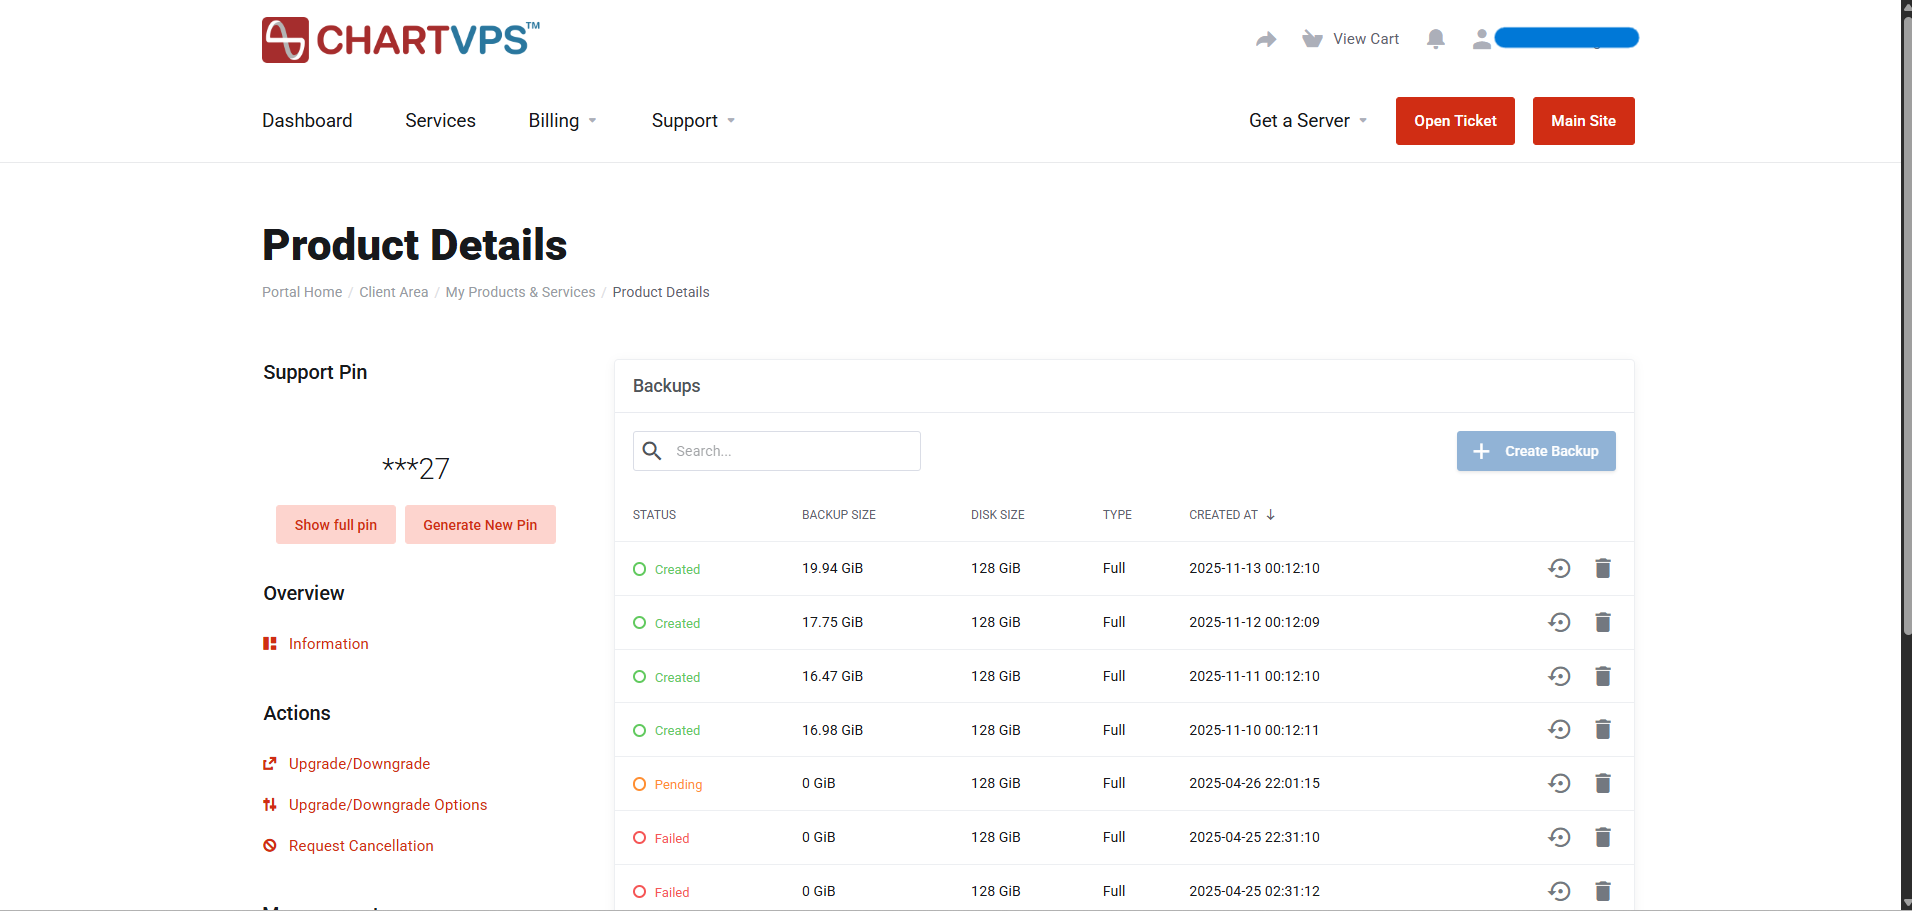
Server Backup Management Dashboard – The Server Backup Management Dashboard provides an overview of recent full backups for your server. Each entry displays key details including the backup status, backup size, disk size, backup type, and creation date.
Backups are retained for the most recent four days. When a new backup is successfully created, the oldest backup is automatically deleted to maintain the retention policy. Backups are scheduled to run and complete at around 00:00 UTC each day.
To restore a server from a backup, click the restore icon located at the far right of the backup entry you wish to revert to. Please note that any data or configuration changes made after the selected backup date will be lost once the restore process is complete.
After initiating a restoration, the status will change to Restoring. The dashboard does not automatically refresh, so it is recommended to manually refresh the page every 15–20 minutes to view progress. Restoration typically takes 30 to 60 minutes, depending on the size of the backup.
Once the restoration is complete, the status will update back to Created, indicating that the backup has been successfully restored.
-
System Performance Monitoring Overview – Monitoring system performance is essential to maintaining reliability, efficiency, and early detection of potential issues. The metrics below offer valuable insights into how your system’s key resources are utilized over time.
CPU Usage – The CPU Usage graph displays the percentage of processor utilization. Spikes in this chart indicate periods of high computational demand, often caused by intensive workloads or background processes. Consistently elevated CPU usage may suggest the need to optimize running applications or allocate additional processing resources.
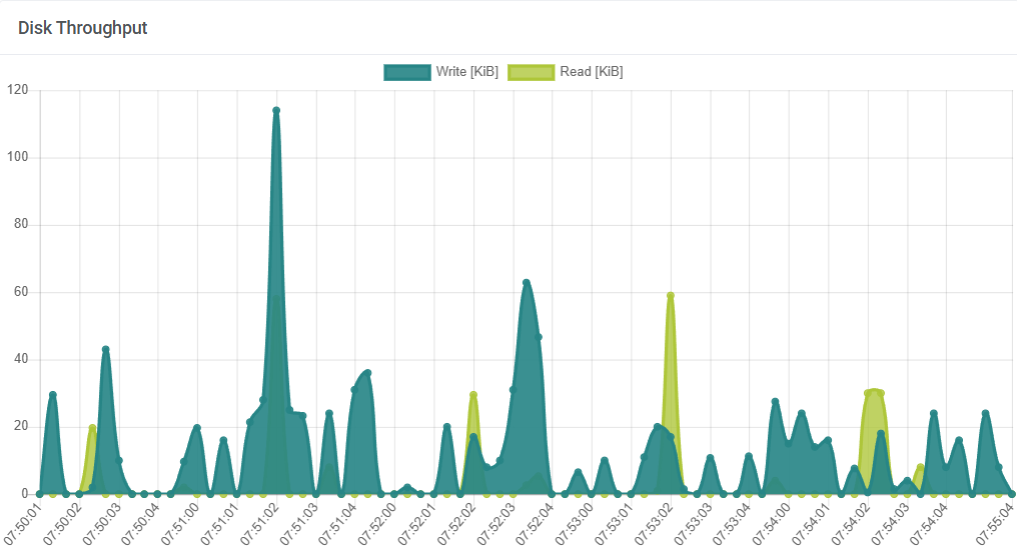
Disk Throughput – The Disk Throughput graph measures the volume of data being read from and written to disk storage. It helps identify periods of heavy disk activity that can impact performance—such as file transfers, backups, or database operations. Persistent high throughput may point to disk-intensive workloads or potential I/O bottlenecks.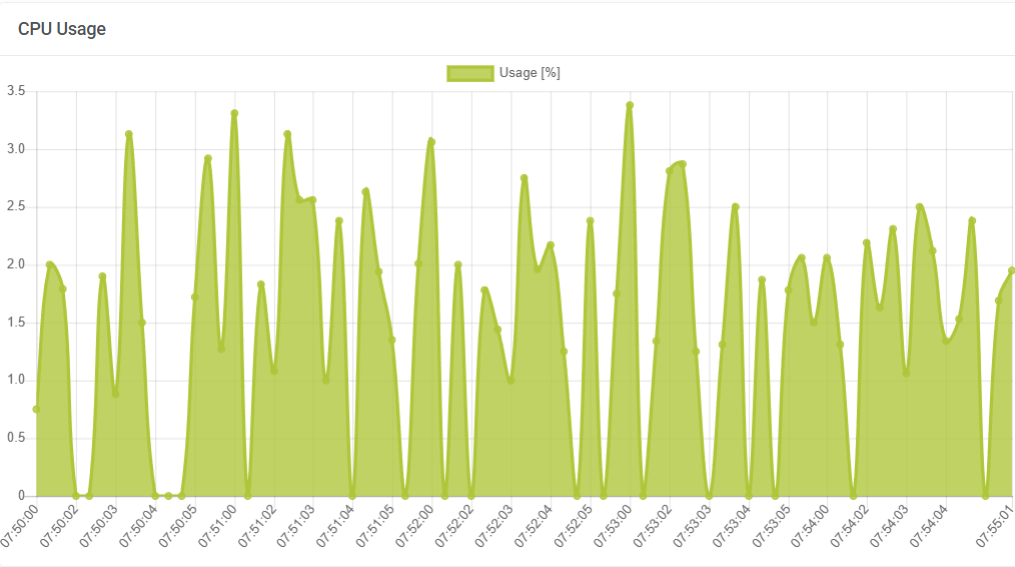
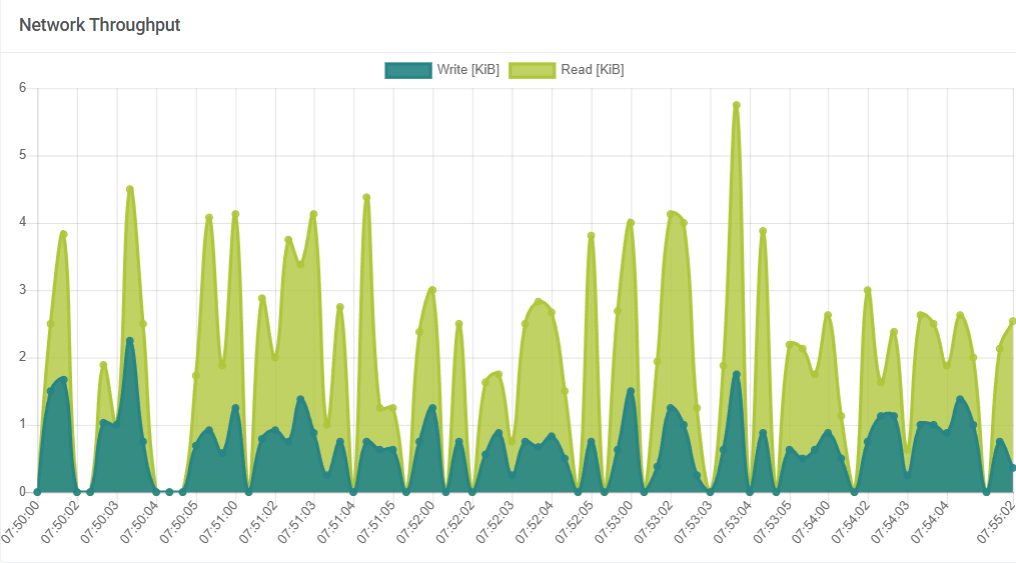
Network Throughput – The Network Throughput graph tracks data transmission rates over time, showing how much information the system sends and receives. Monitoring this metric helps detect network congestion, bandwidth saturation, or unusual traffic patterns that could affect connectivity and overall responsiveness.
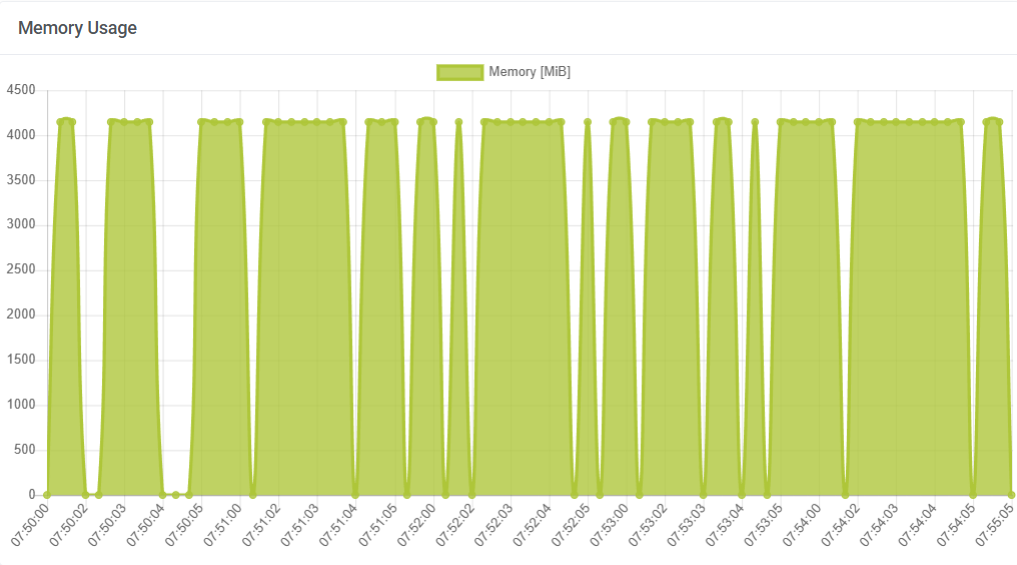
Memory Usage – The Memory Usage graph illustrates how much system memory is currently in use versus available capacity. This metric is critical for identifying memory-related constraints, such as applications consuming excessive resources or memory leaks. Sustained high memory utilization can degrade performance and indicate a need for optimization or additional capacity.
 Together, these metrics provide a comprehensive overview of system health. Regularly reviewing CPU, disk, network, and memory performance helps you proactively detect issues, optimize resource allocation, and ensure long-term system stability and efficiency.
 -
Network Configuration Overview – The system management interface provides a clear overview of your network configuration, highlighting key details about the active network connection IP Address: 192.168.100.100 – In this example, ip address is a unique address that identifies your server on the network. Default Gateway: 192.168.100.1 — Routes traffic between your local network and external networks or the internet. Name Servers: 8.8.8.8 (primary) and 8.8.4.4 (secondary) — These servers translate domain names into IP addresses, enabling internet connectivity. Primary Network: This connection is set as the system’s main active network interface, meaning it handles most network communication.
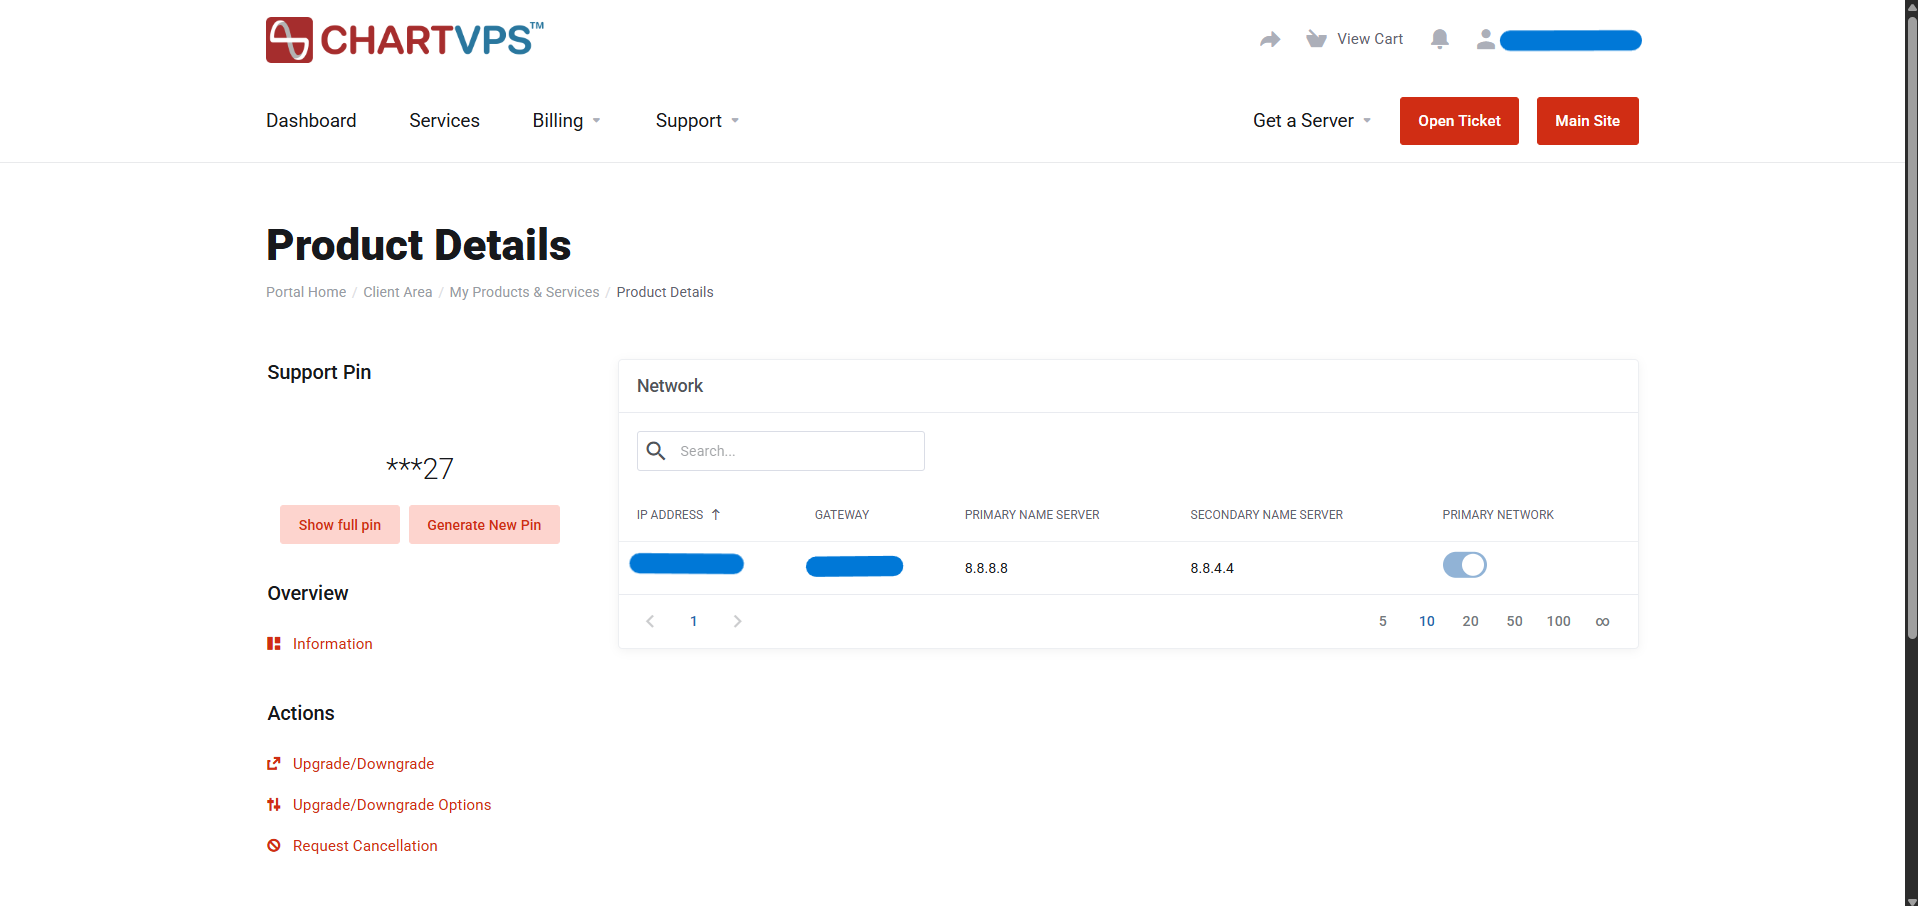 This interface provides a concise summary of essential network parameters, allowing you to quickly verify the status and configuration of your system’s connection.
 -
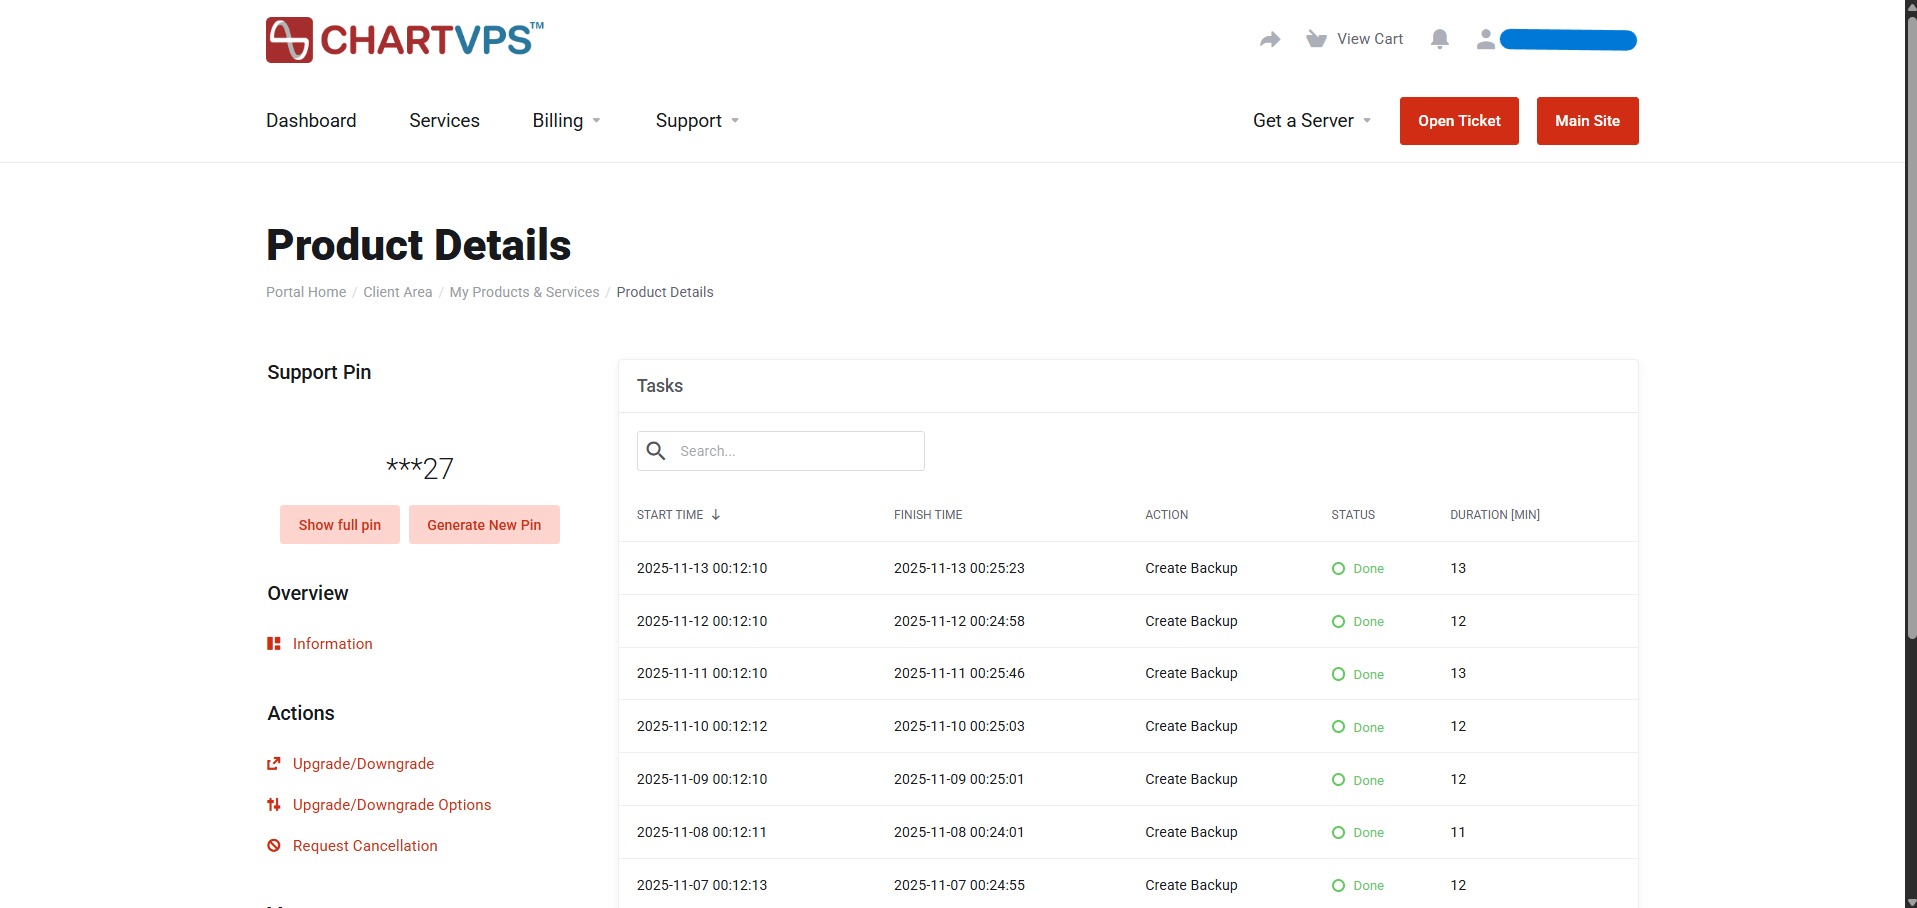
Task Logs – Task Logs provide a detailed history of all important actions performed on the server. This includes activities such as starting, stopping, or restarting the server, entering rescue mode, performing backups, restoring data, and other background operations. By reviewing these logs, you can see exactly what actions have been taken, when they occurred, and whether they were completed successfully. Task Logs are a valuable tool for monitoring server activity, troubleshooting issues, verifying backup and restoration tasks, and ensuring the server is running smoothly. They make it easy to track changes and maintain transparency in server management, giving administrators and users confidence in the system’s reliability.
How To Control the Server From the Portal
