


-
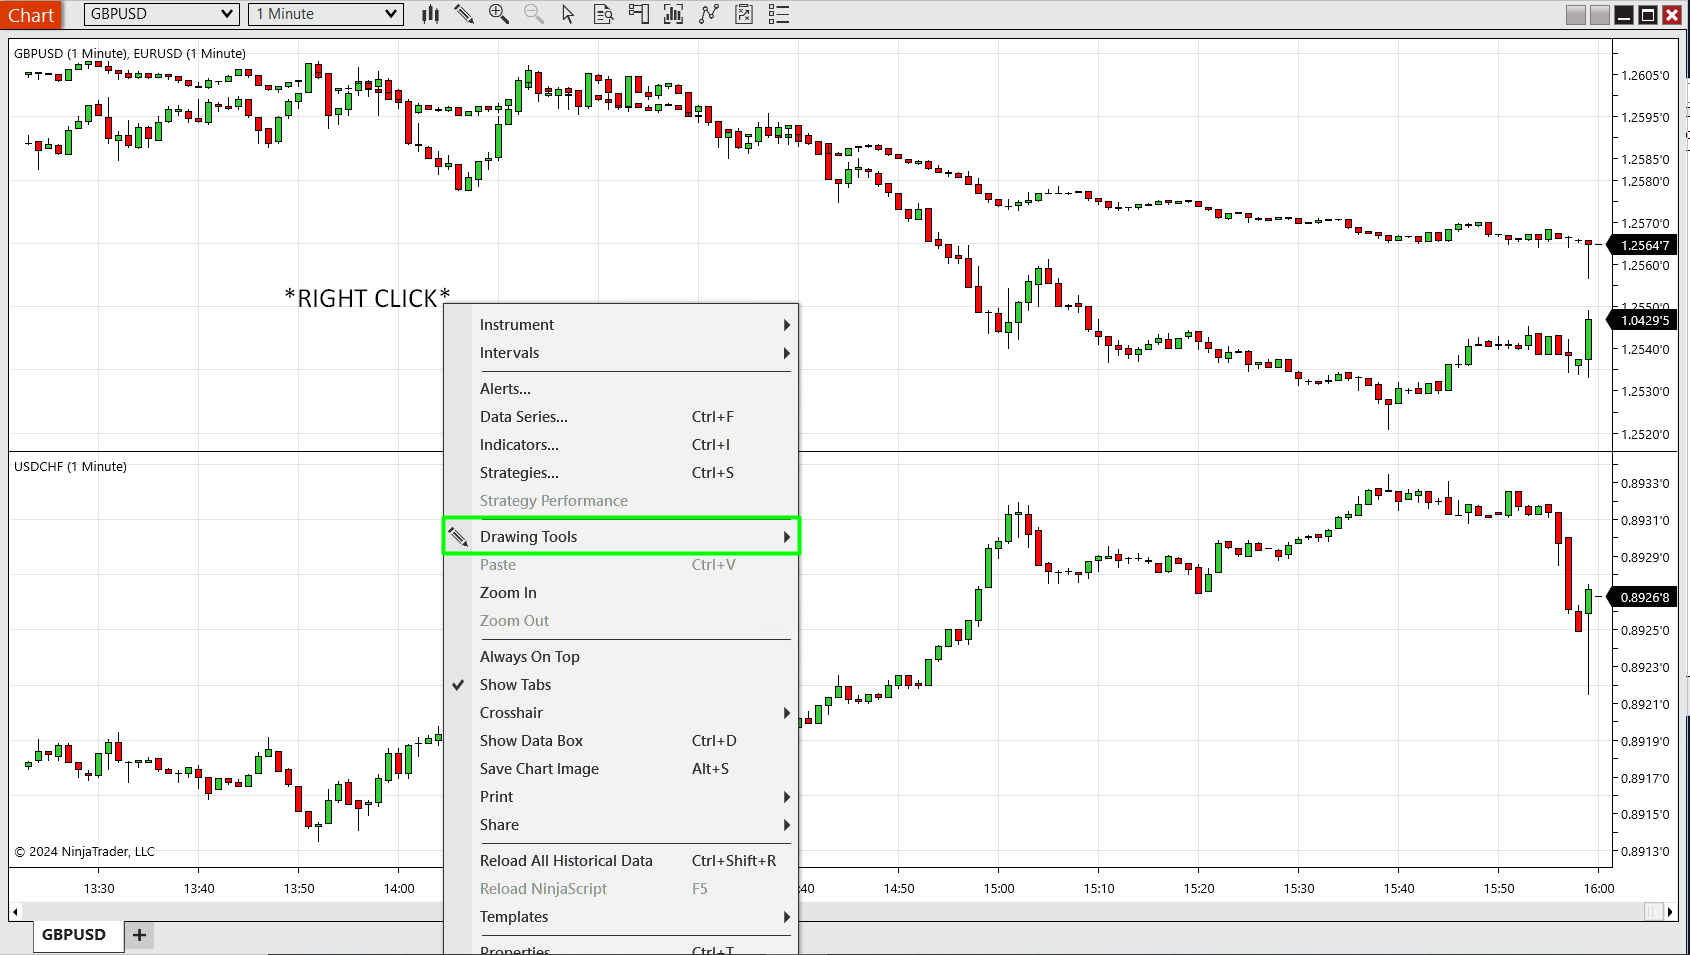
First you start with the right click on the chart where you want to add the drawing tool to and select Drawing Tools:
-
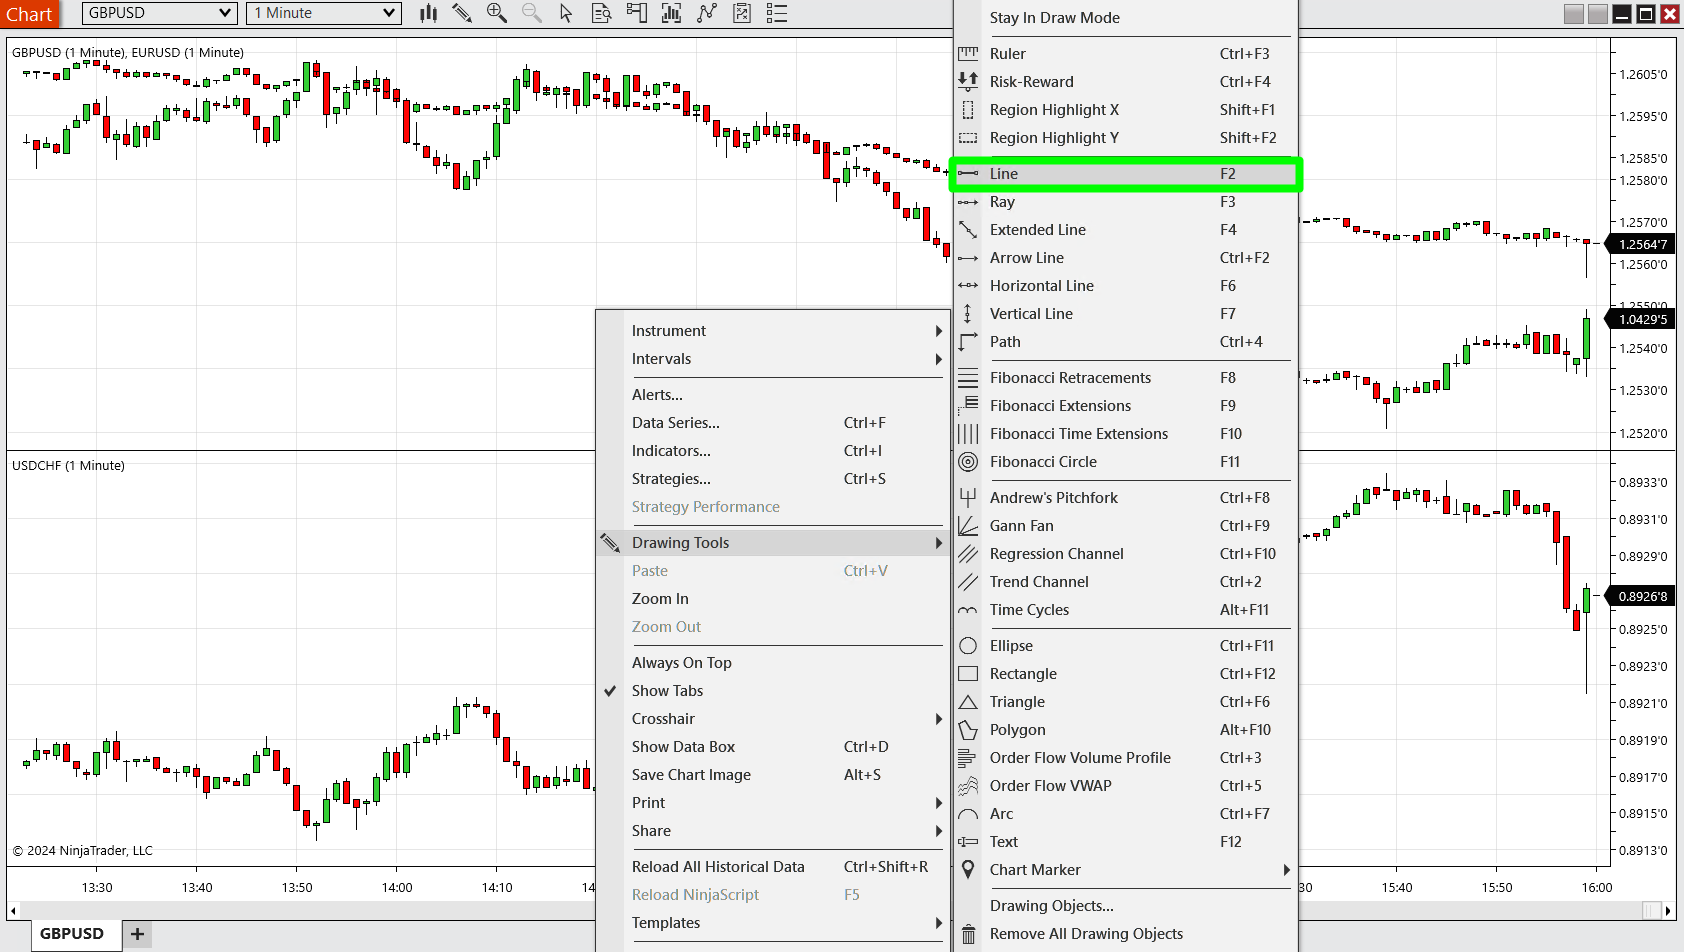
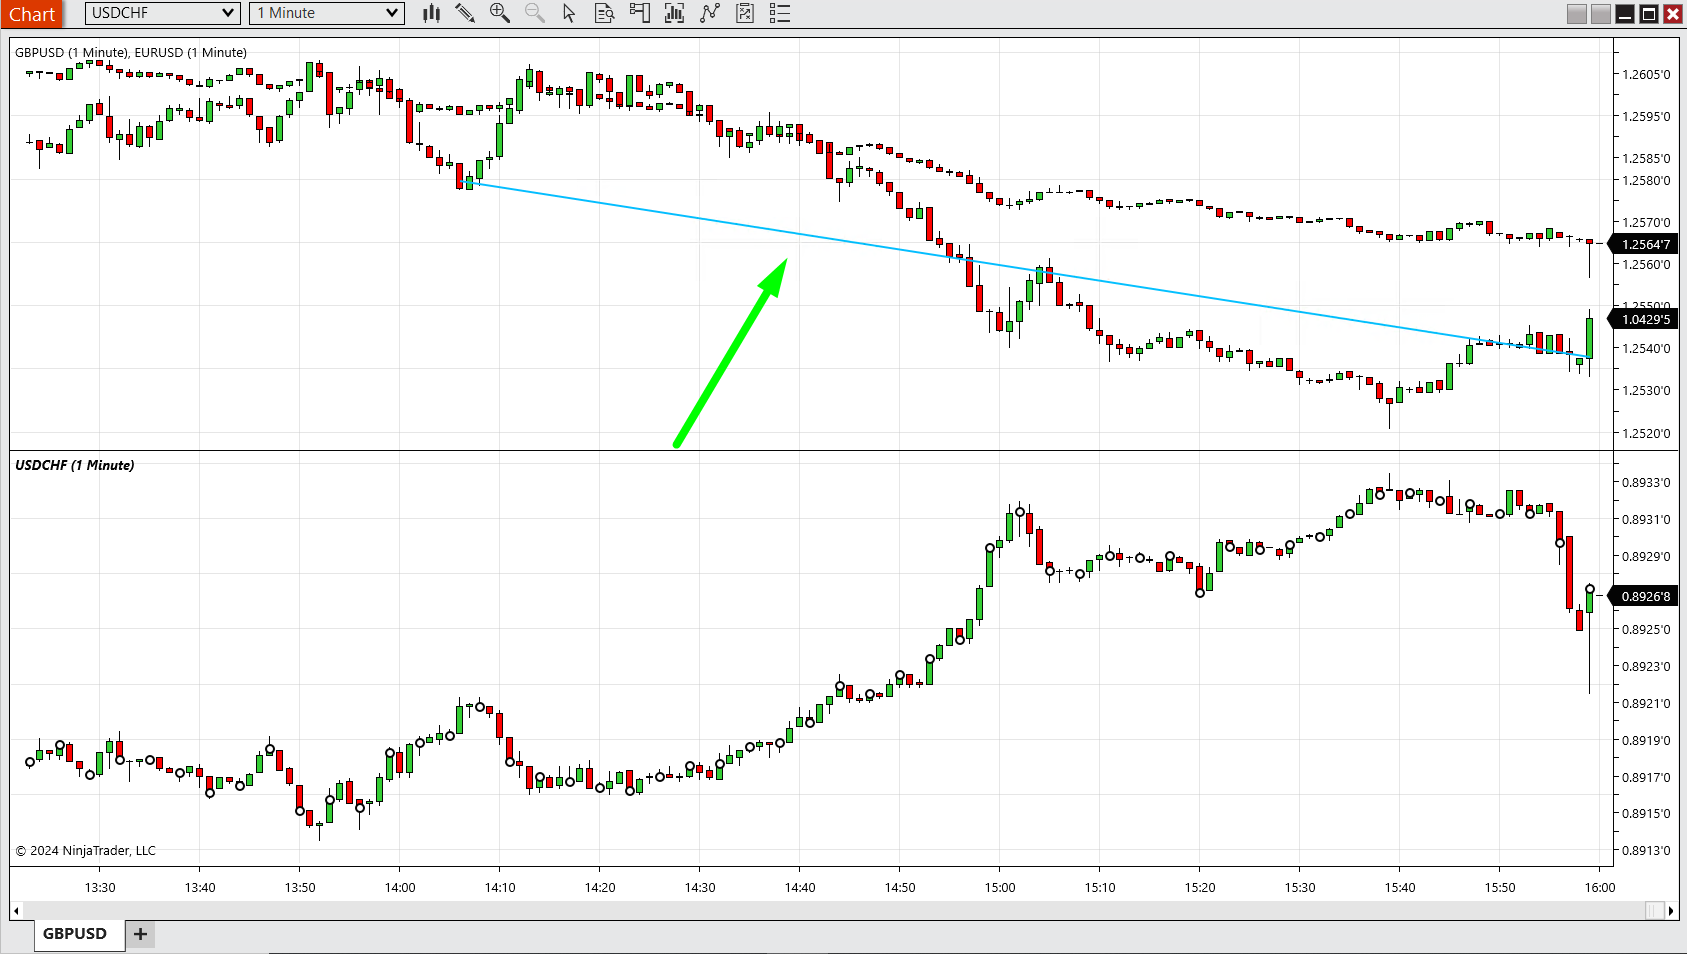
Then you will see this big menu with all the tools listed. In this case, we will select LINE tool. The LINE tool is an excellent resource for pinpointing key areas of interest on your chart. It allows you to draw lines to mark significant time intervals or critical price levels, providing clear reference points to enhance your market analysis:
-
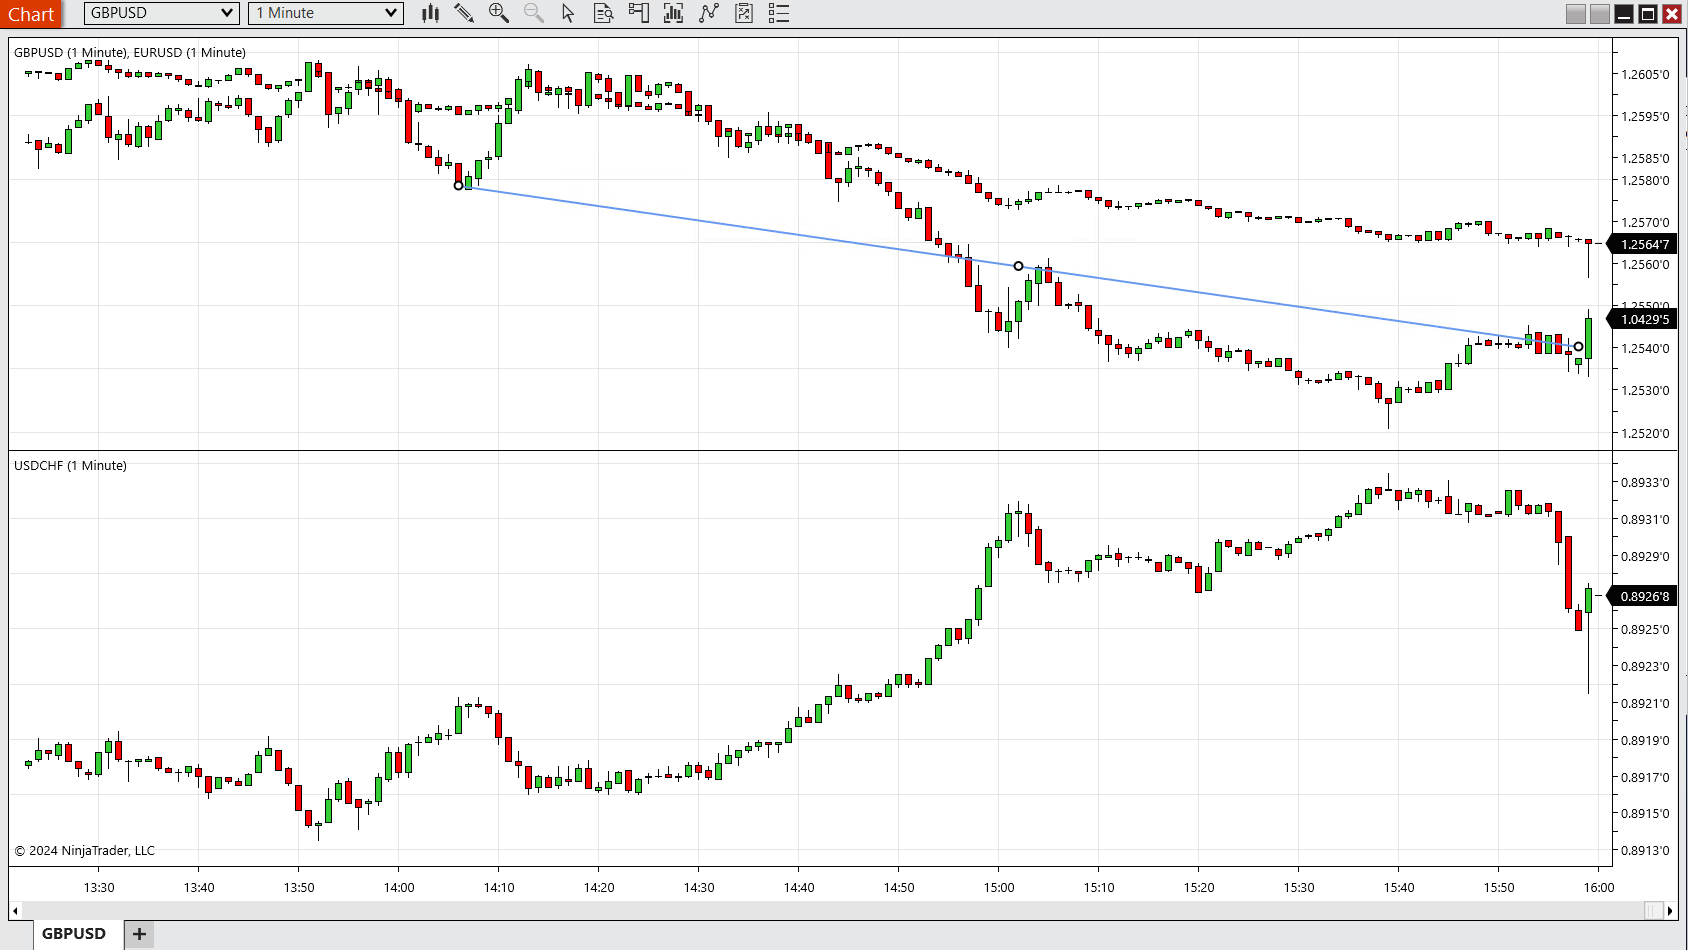
Once you select the desired tool, you can define the specific time frame or price level you wish to emphasize, ensuring your analysis is precise and focused.
-
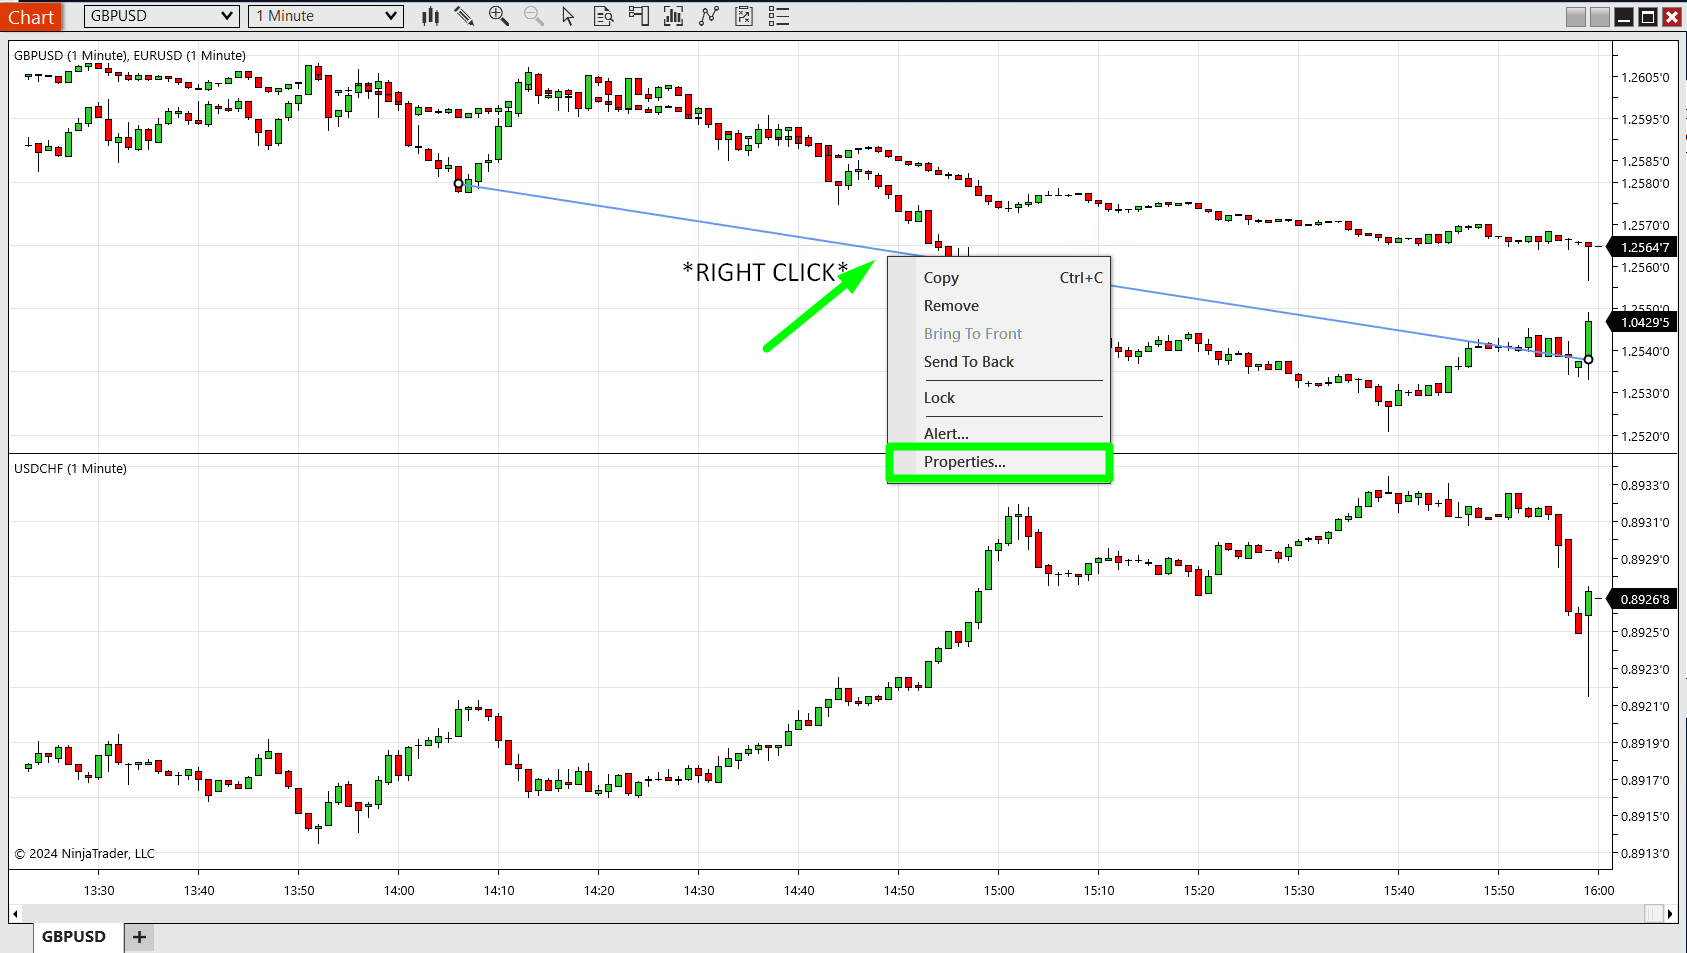
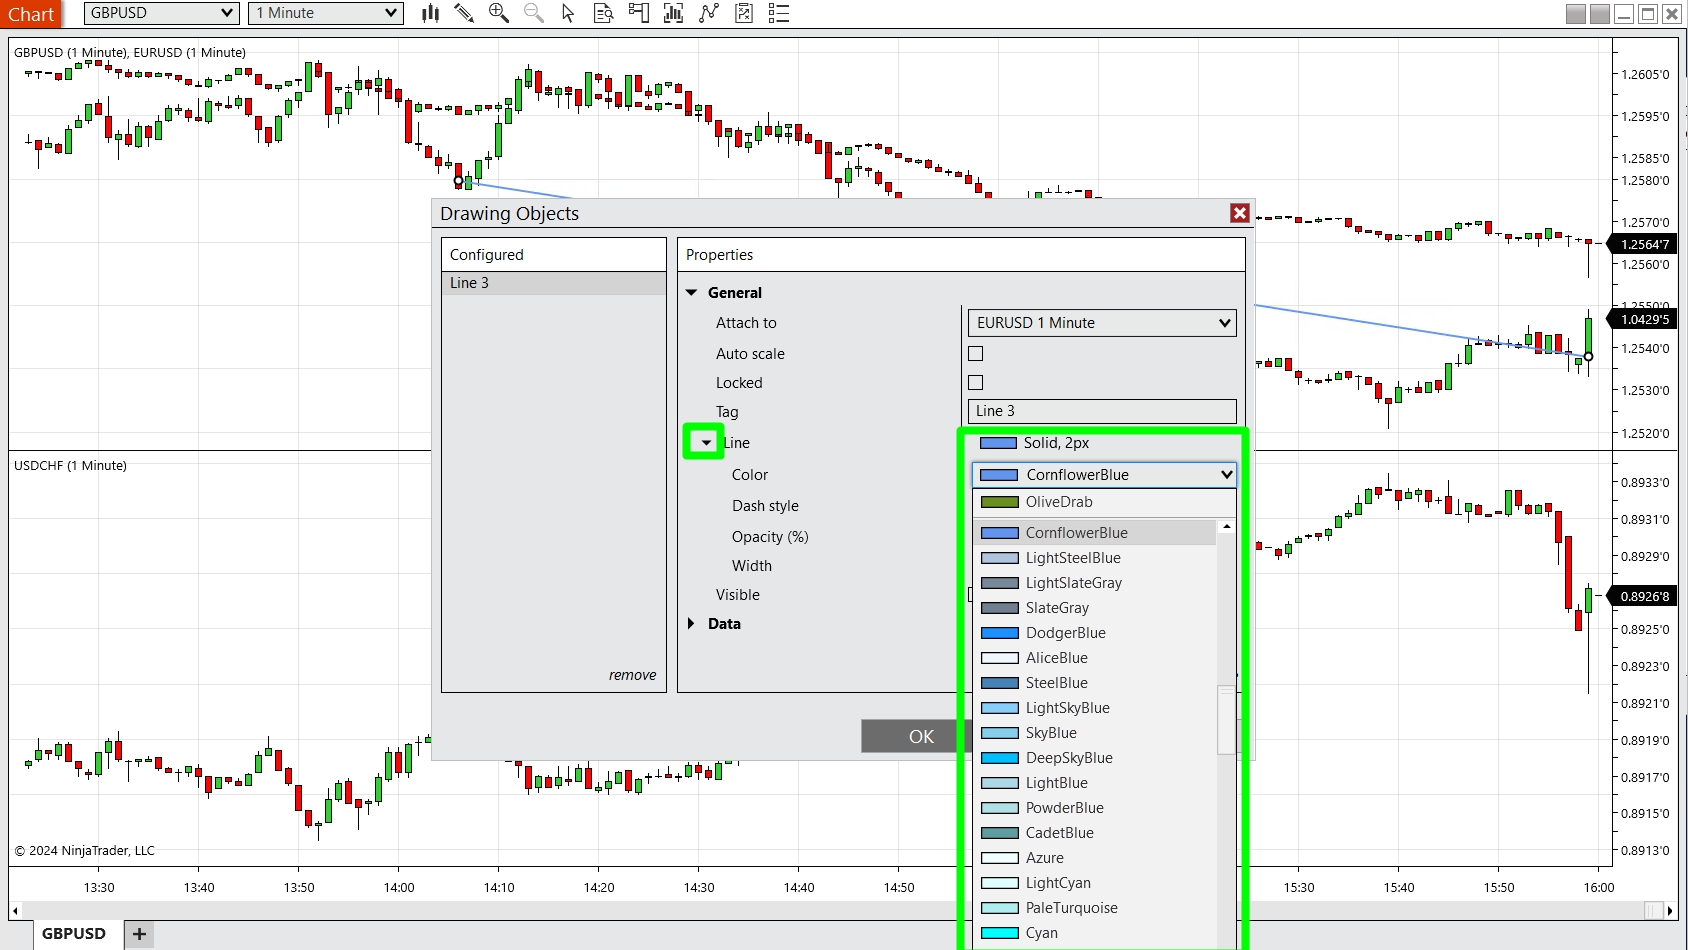
You can also customize the TOOL you added by selecting it and clicking on the properties option:
-
For example- here you can customize the color of the tool if you use more than one tool, for easier tracking:
-
Click on APPLY and the changes you made will be applied to the tool:
-
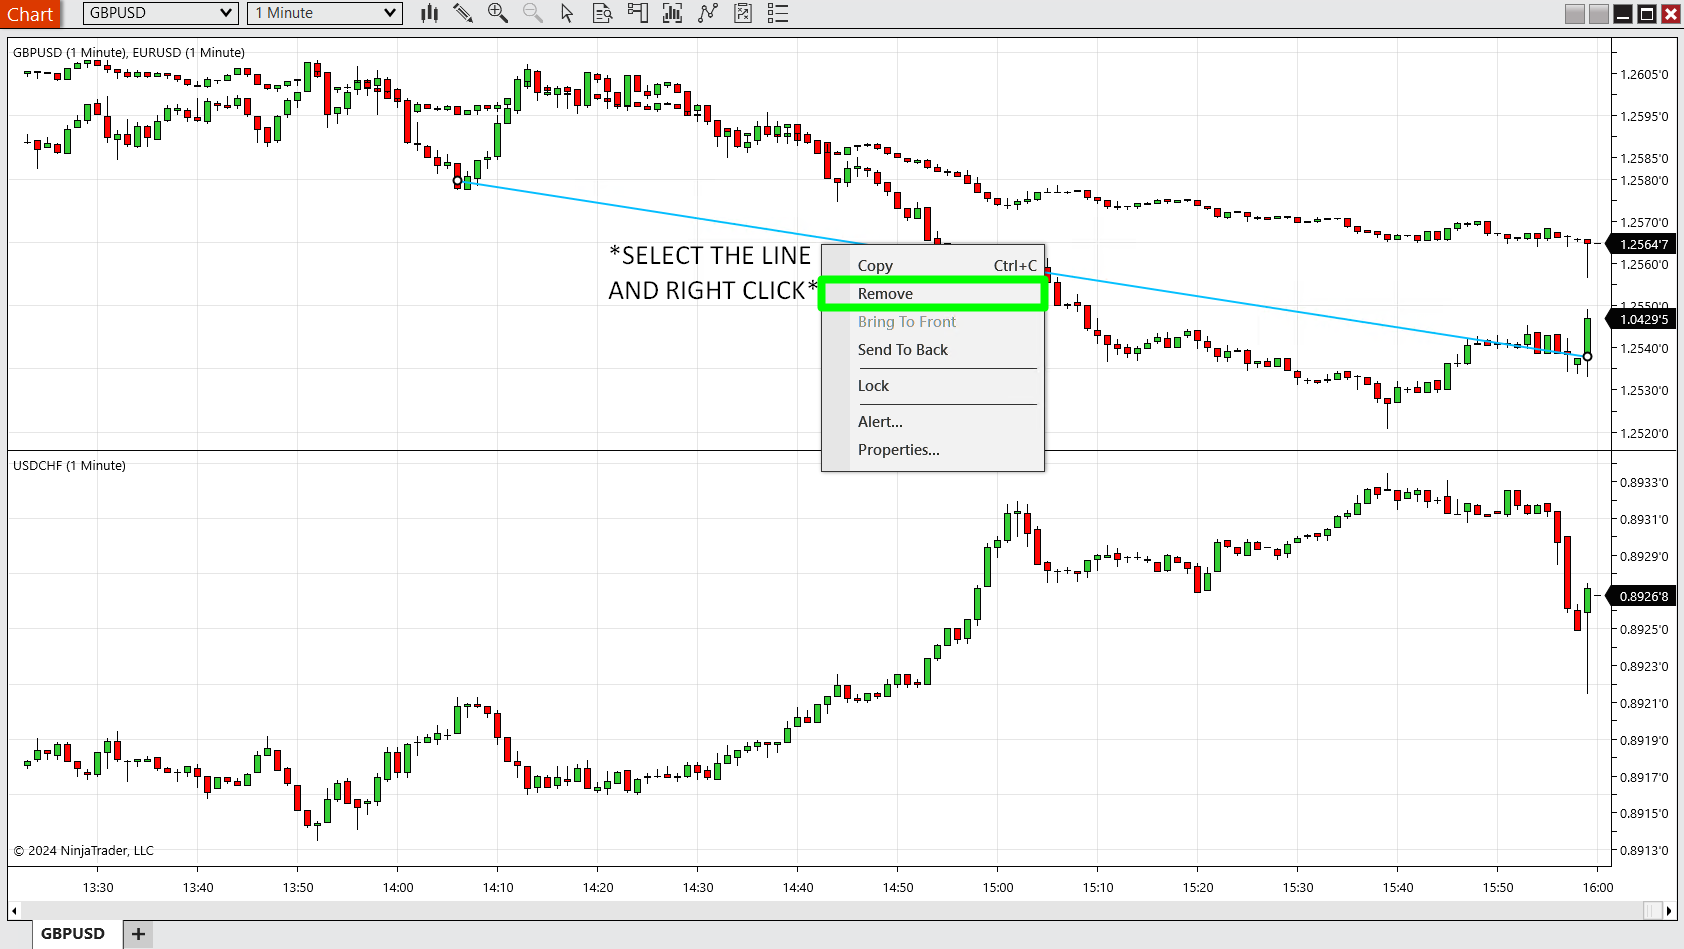
And to remove the tool once you finish tracking or don’t need it anymore, you simply select the tool with the left click, then right click on it and select REMOVE option:
- And for overlaying multiple instruments when doing technical analysis, just like we did in this guide- you can check this article on how to do it: https://chartvps.com/helpdesk/how-to-add-multiple-instruments-into-a-ninjatrader-chart-panel/
