By saving your chart layouts with indicators, timeframes and drawings- you don’t have to reconfigure them every time you open TradingView. And it allows you to quickly toggle between different setups
-
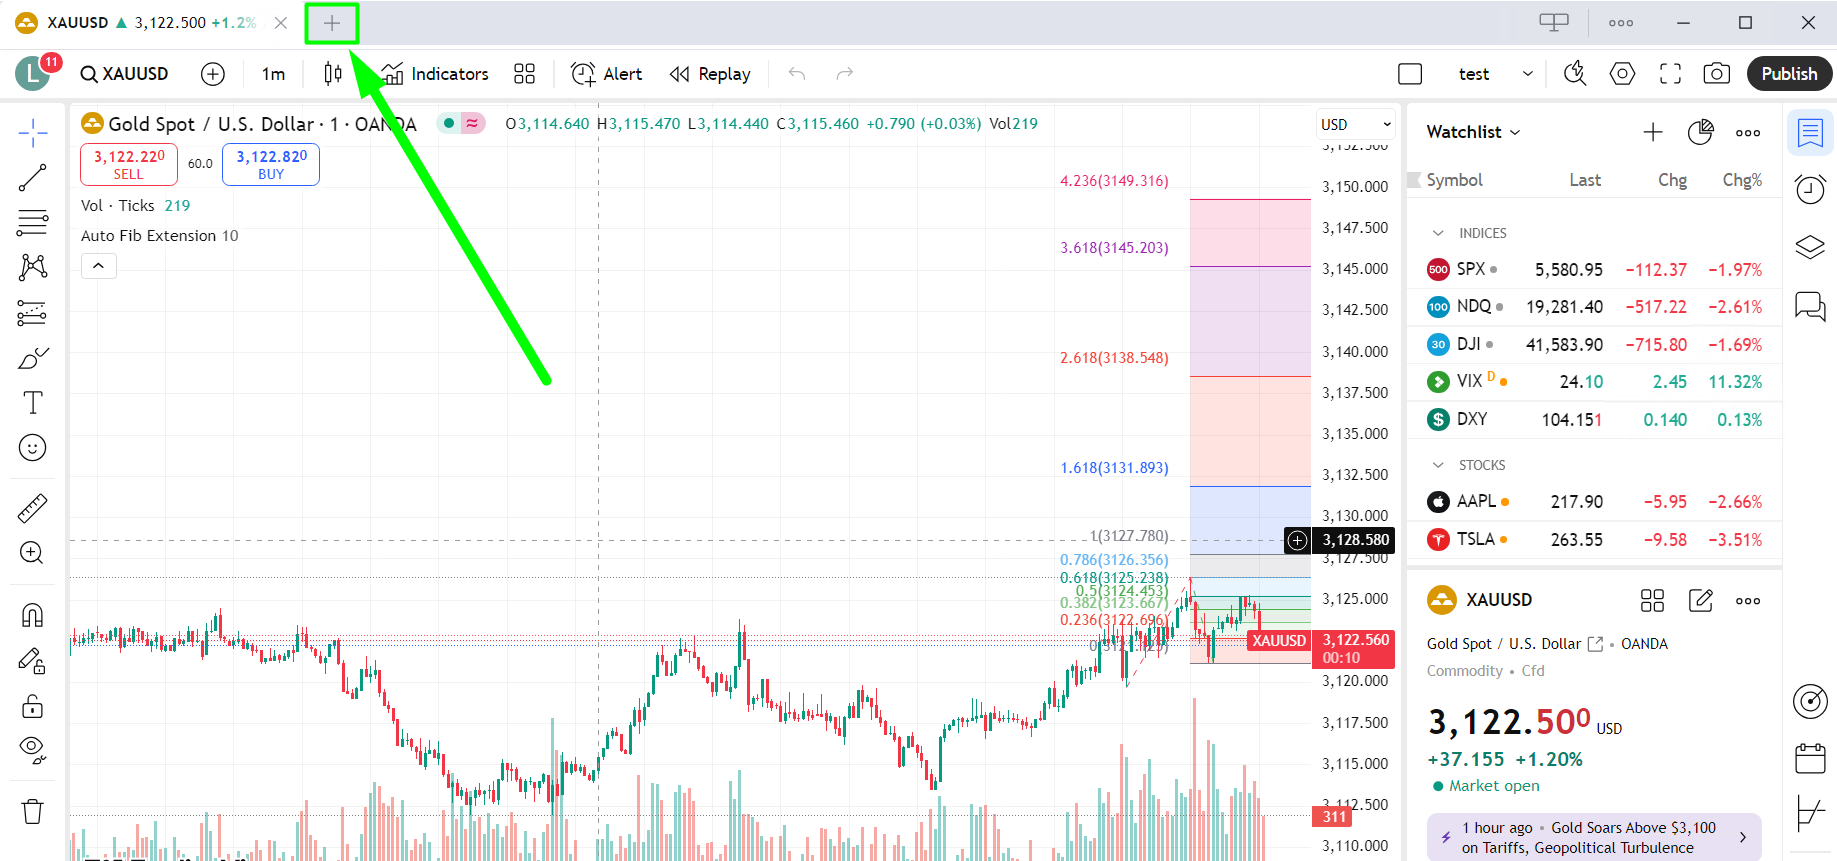
To create new chart layout- simply click on + (PLUS) button in the tabs menu:
-
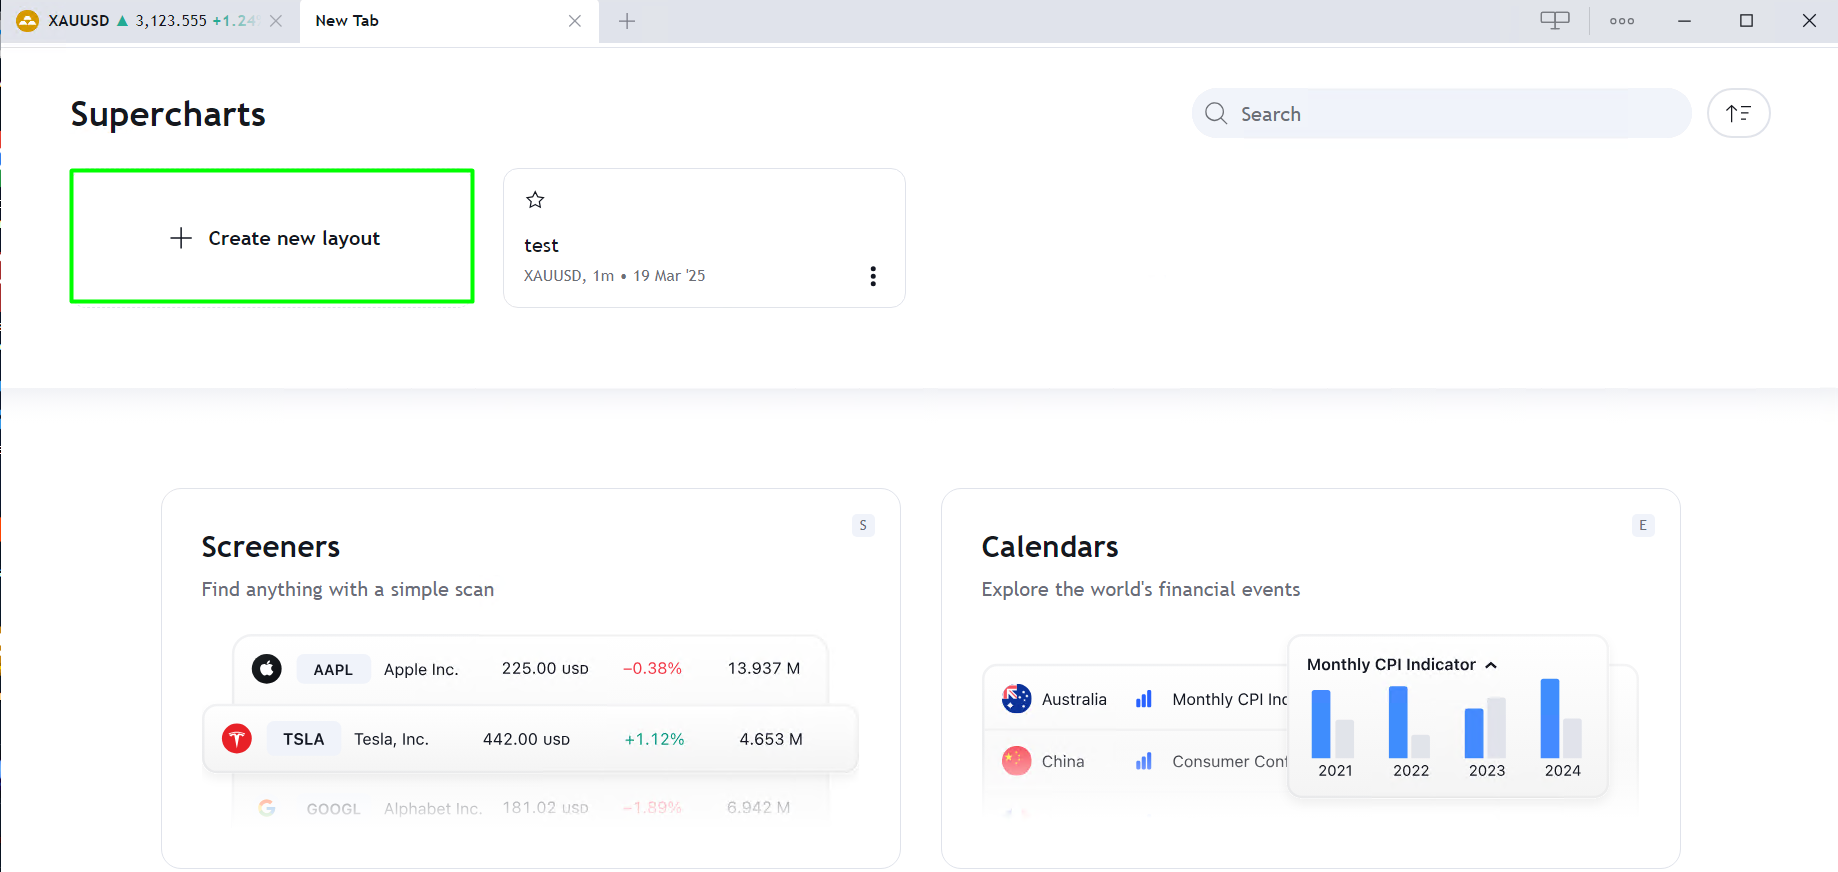
Select Create new layout option:
-
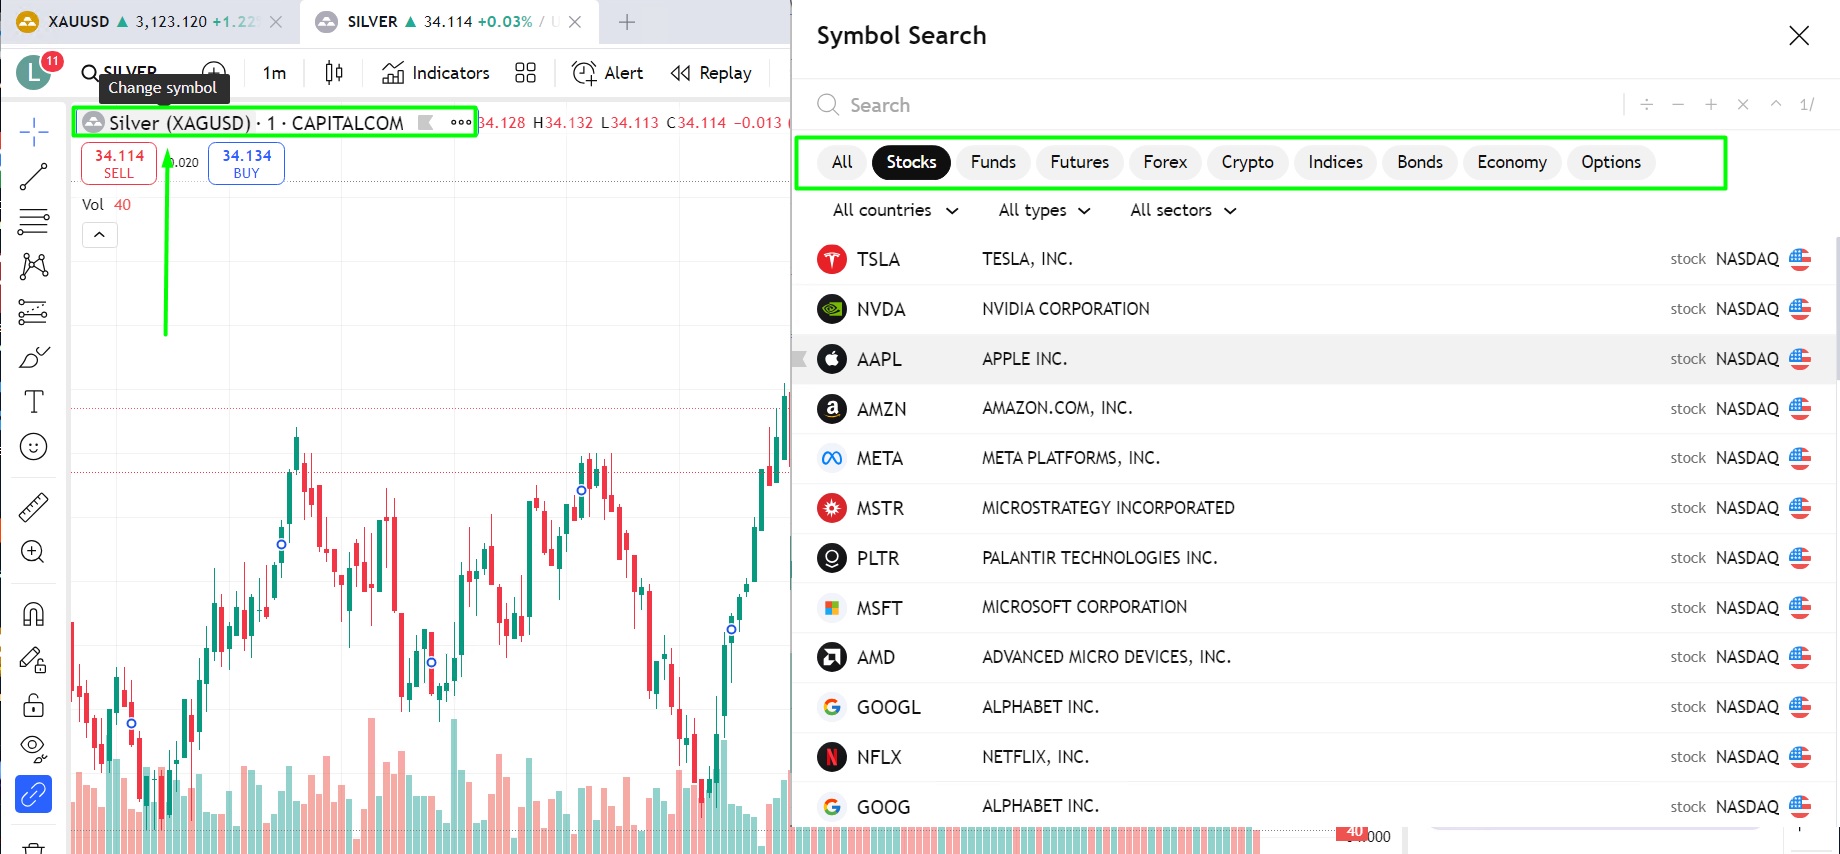
You will then have an option to choose the symbol you’d like to add to a chart, just like we chose Apple Inc. here:
-
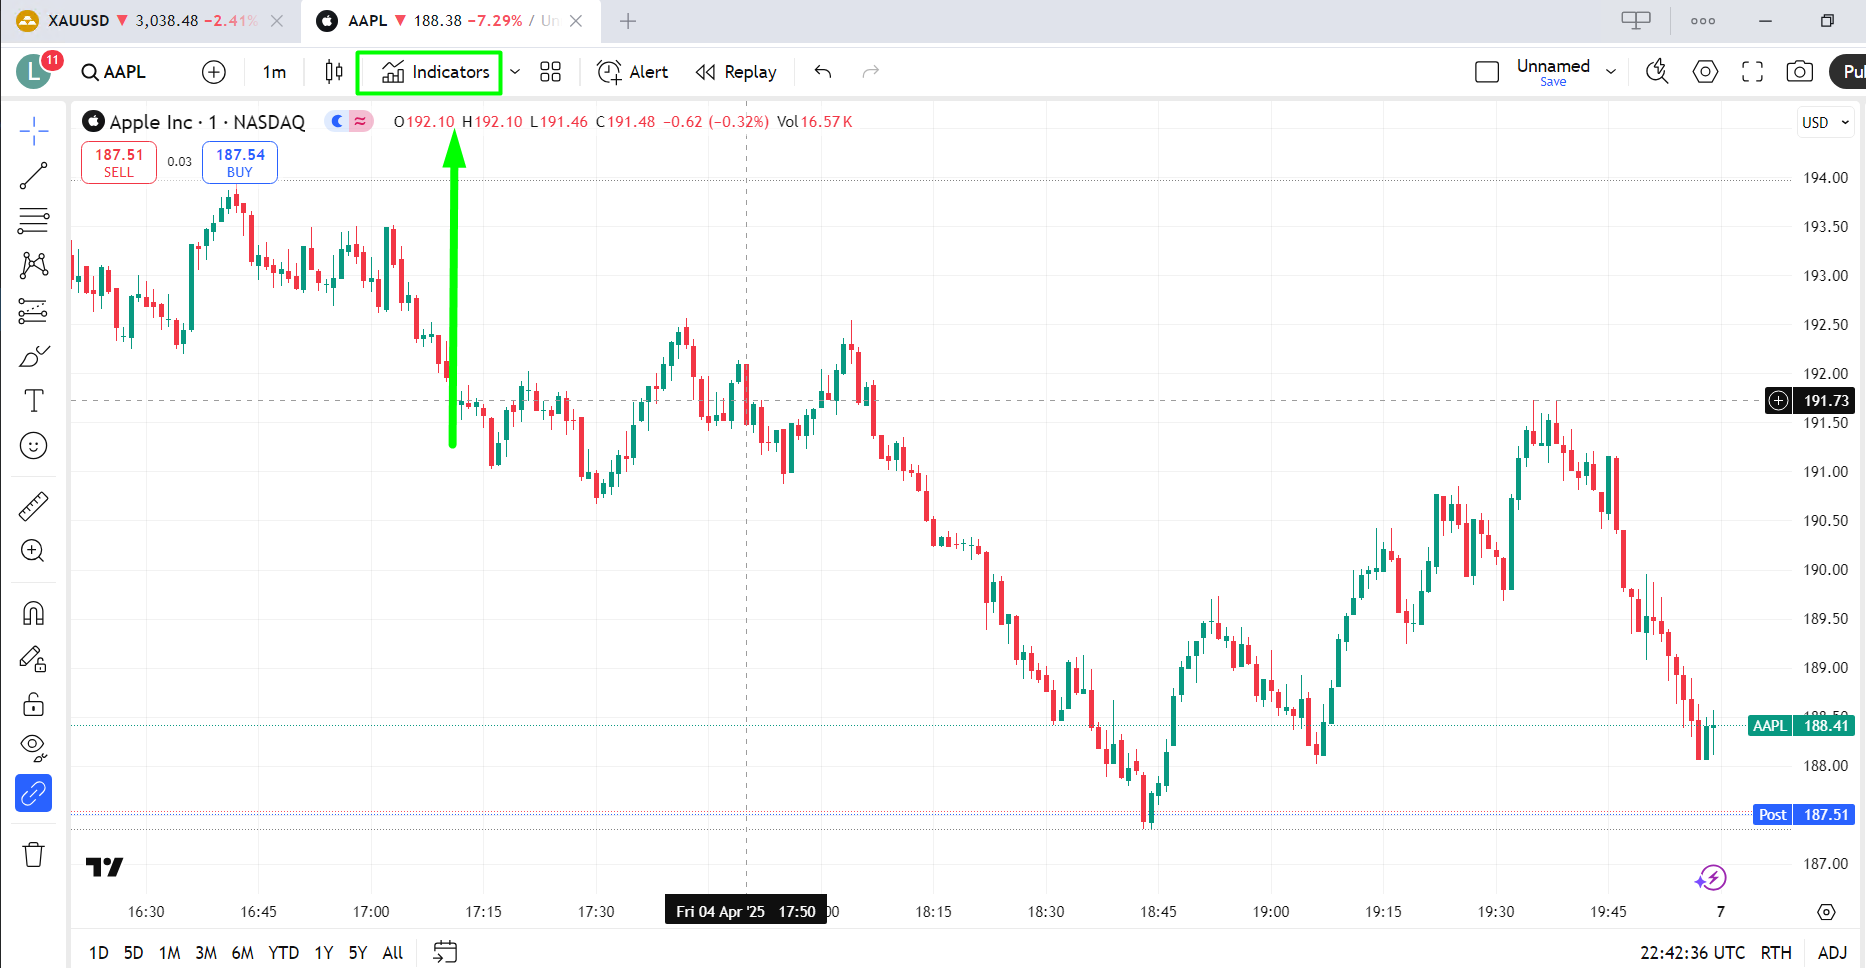
To add Indicators to the chart you have created- simply click on Indicators tab:
-
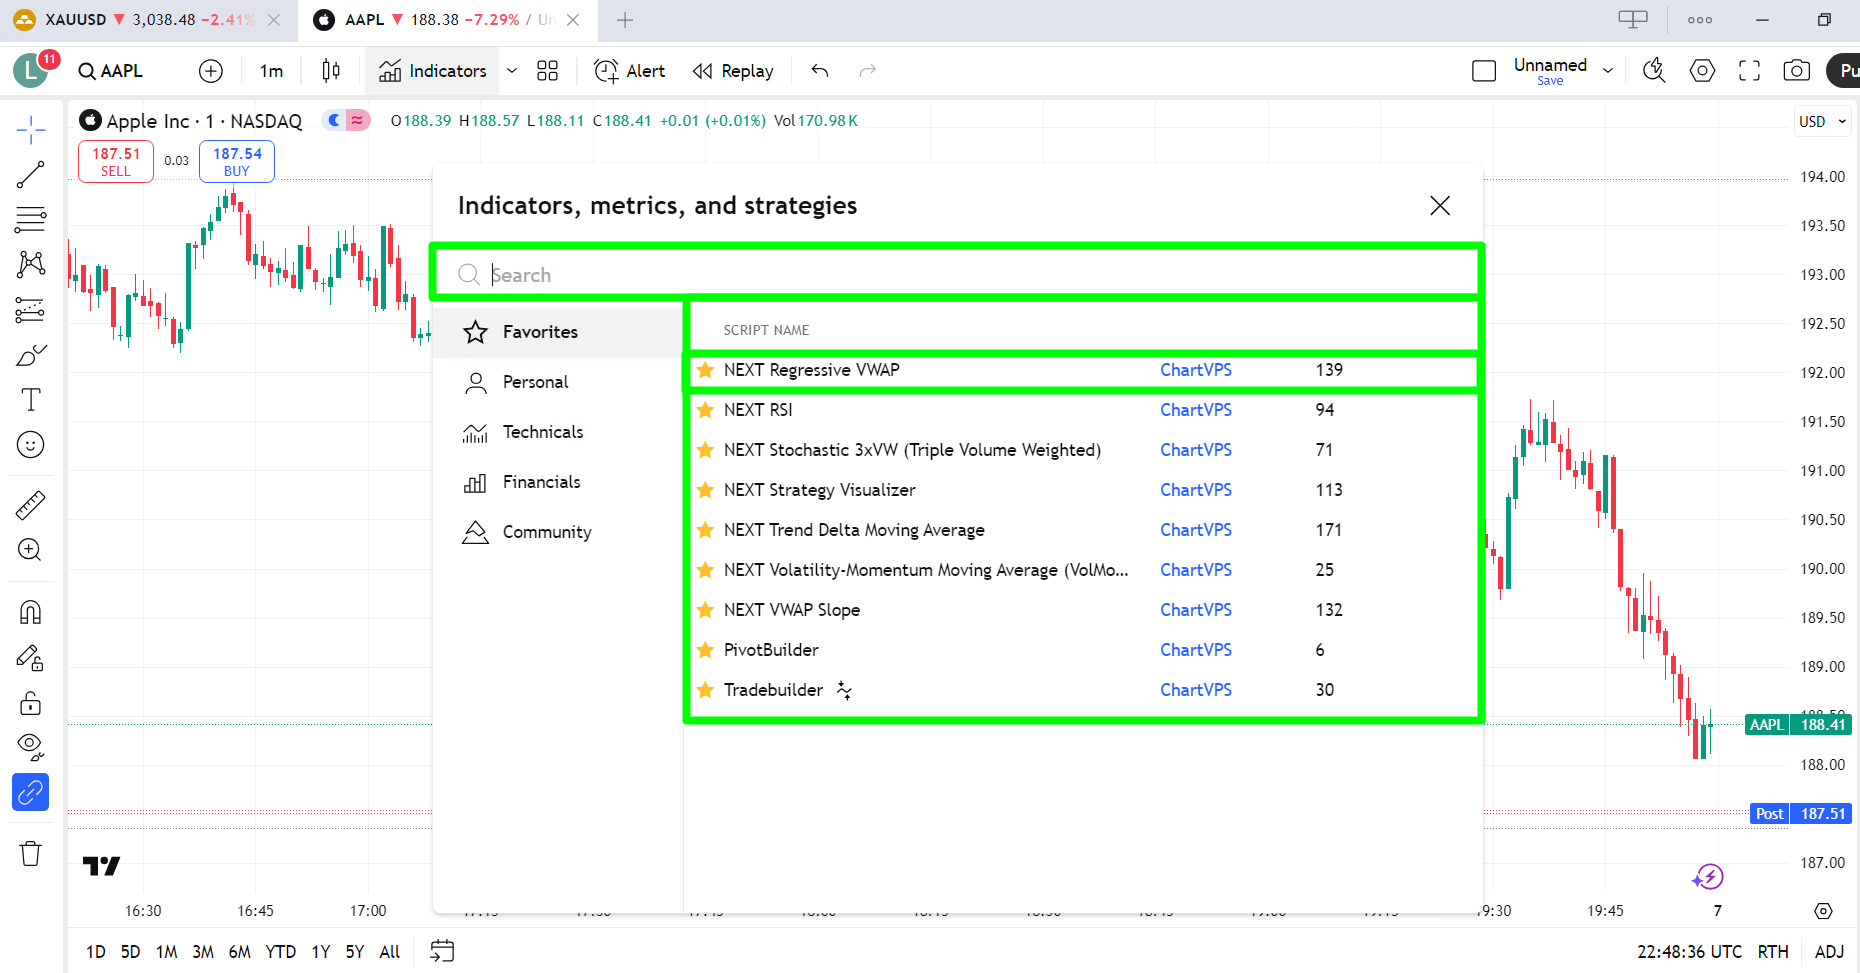
You will then have an option to search for pre-built indicators or you can use the one you added, just like we used ChartVPS NEXT Indicators here:
-
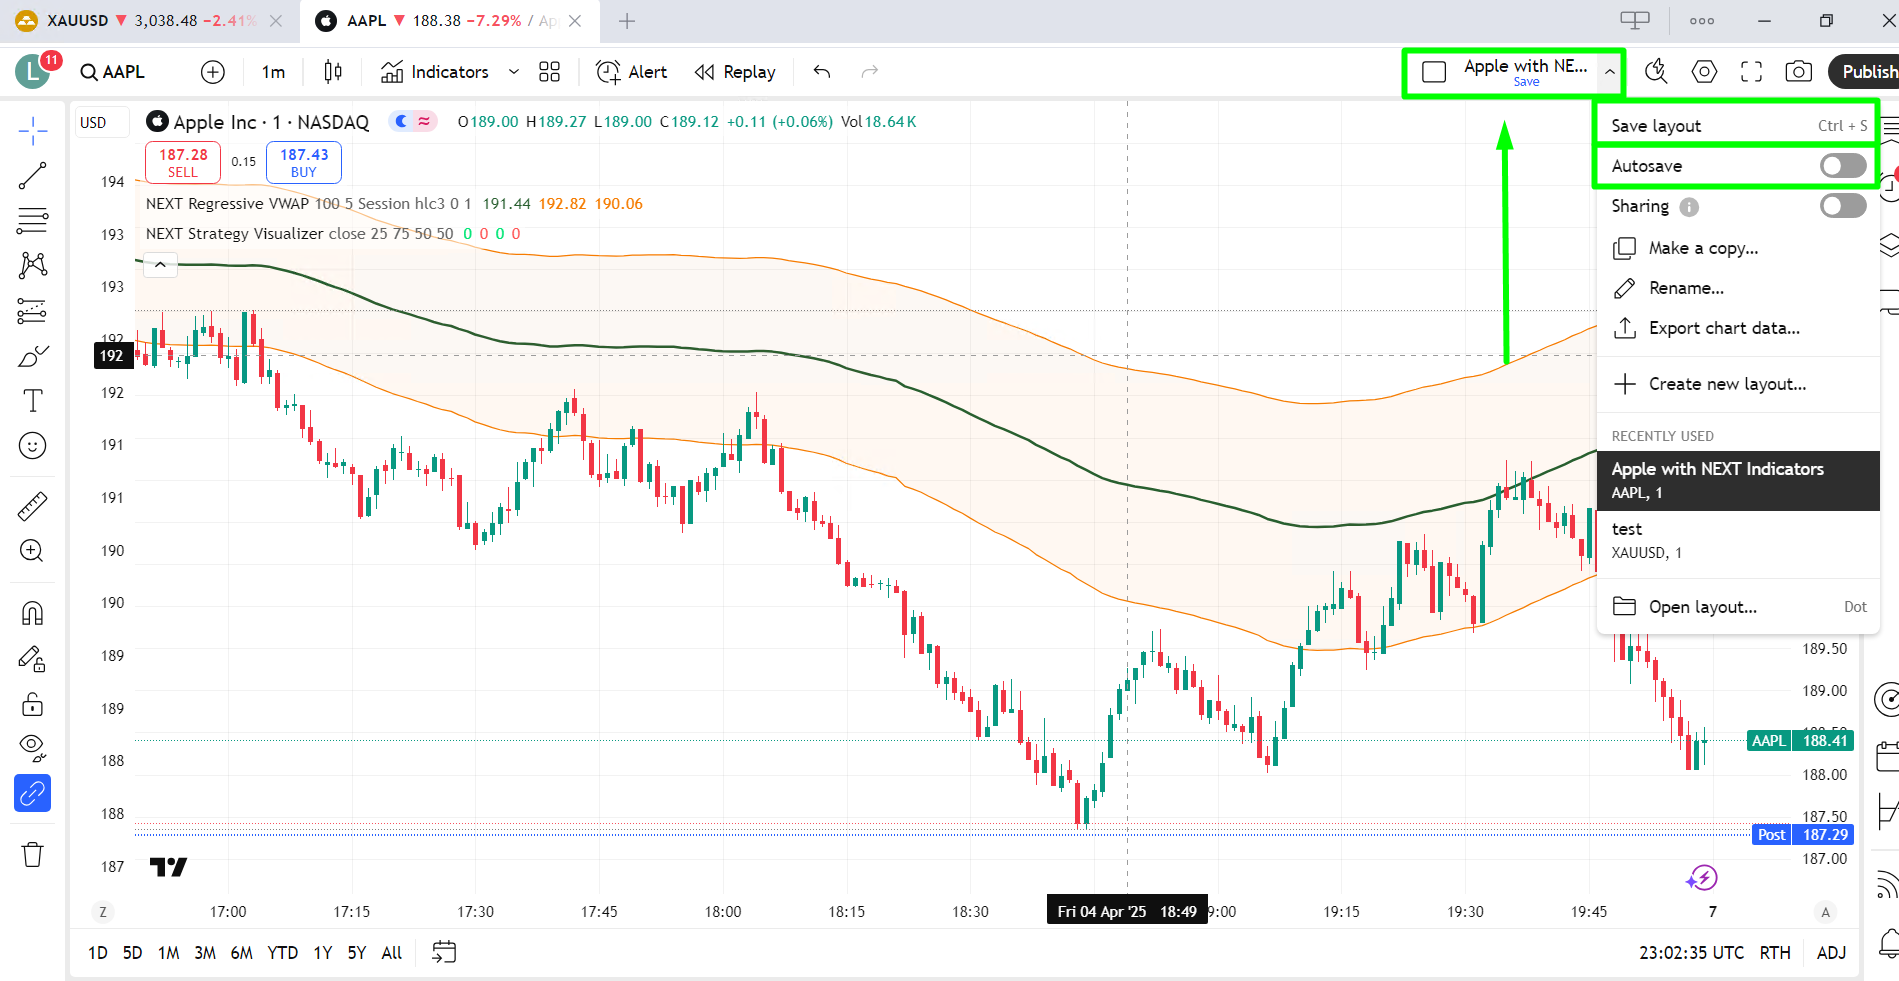
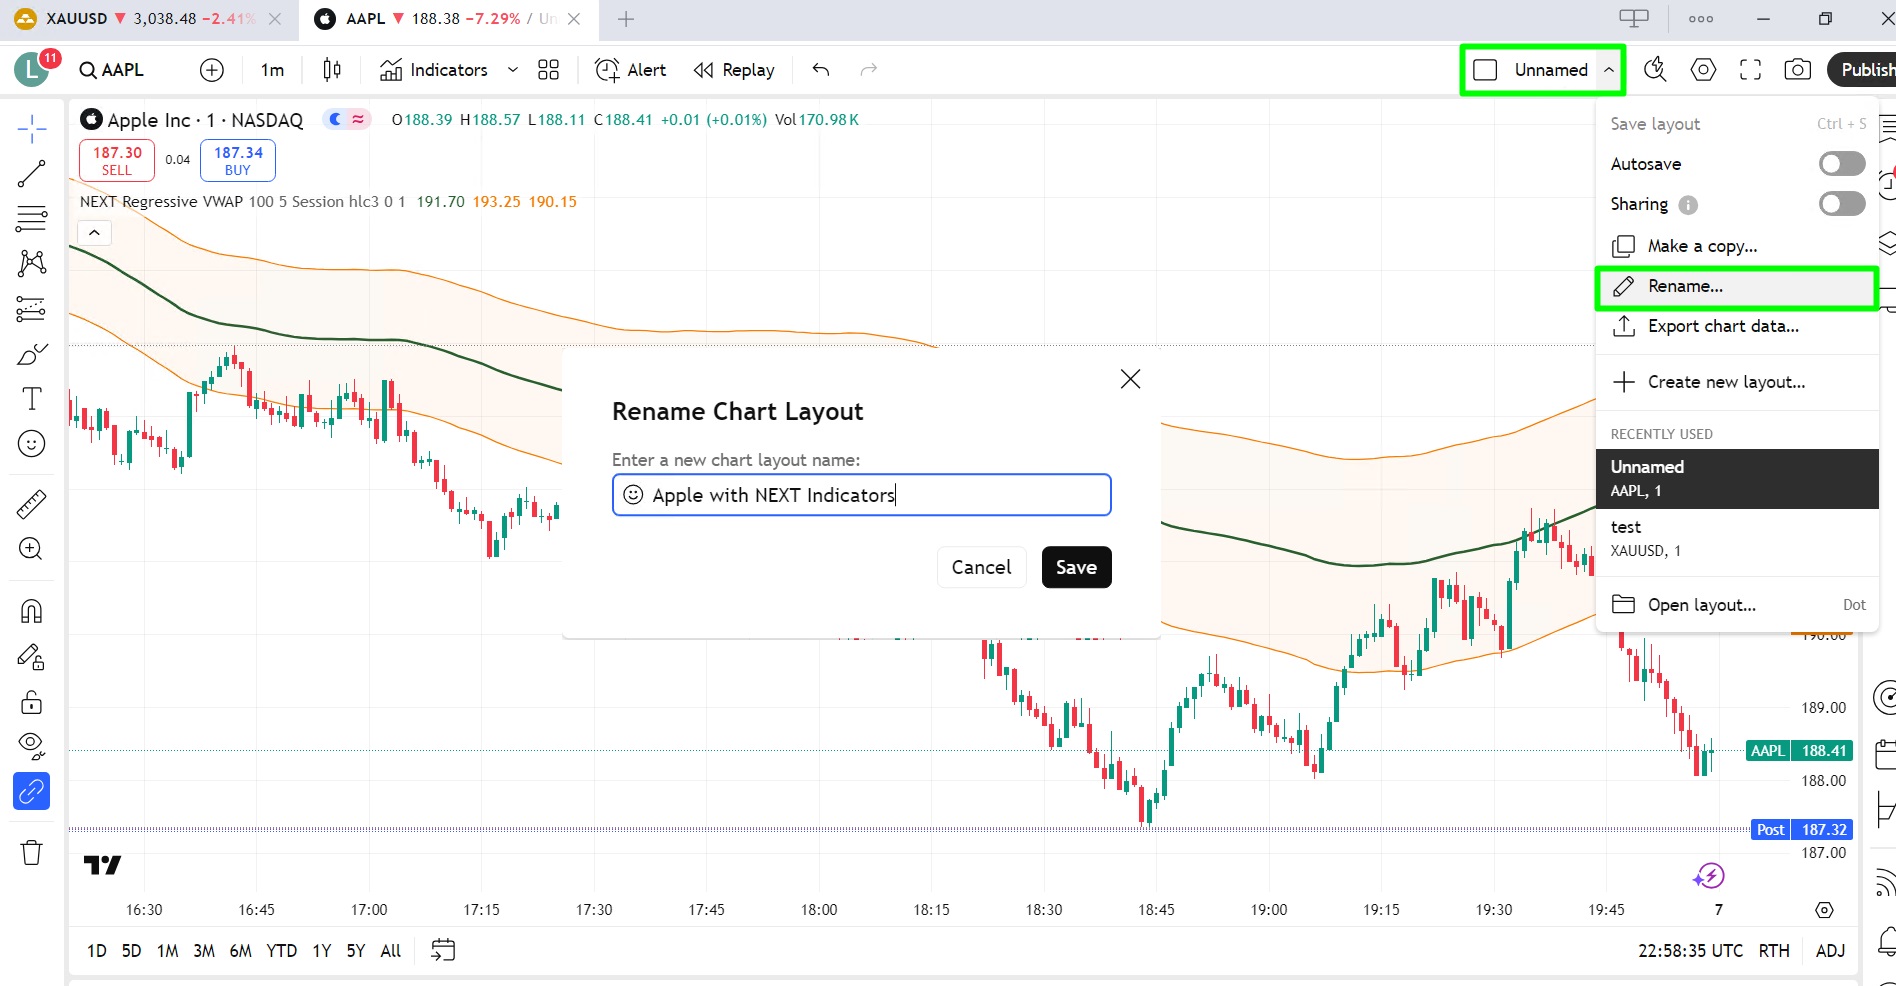
In this tab- you can rename the layout you created:
-
And you use the same tab to save the layout you created with all the indicators and strategies added. There is also an option to enable Auto-Save after every change you make: