


The Basics of VWAP
VWAP, or the Volume-Weighted Average Price, is a major aspect of technical analysis. Traders of all experience levels use it to figure out a security’s average price over a set period of time, which is typically a day. If any of this confuses you, don’t worry – we’re delving into it all in today’s Workshop article. But hey, that’s enough preamble — let’s dive in with a pretty important question: What exactly is VWAP?
What is VWAP?
VWAP accounts for how many shares of a stock were traded at each price point, which in turn helps to nail down a security’s average price over whatever specific time period you’re interested in. To simplify it, VWAP finds an average price by calculating the number of shares traded at each price point in relation to the total volume of shares. Despite being cumulative, VWAP is usually reset at the start of each trading day for maximum accuracy.
But How Exactly is VWAP Calculated?
Good question — there’s a specific equation used. The equation is as follows:
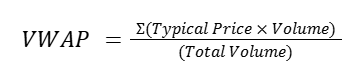
Now, let’s look at what each of these variables means:
- Typical Price: The standard price for your chosen time period. This is calculated through the equation (High + Low + Close)/3.
- Volume: How many shares were traded in the previously chosen time period (e.g. five minutes).
- Total Volume: The total amount of shares traded since the trading session began.
So, to break it down step-by-step: You get the total price by adding the high, the low, and the close together, which is then divided by three. Then, you multiply the typical price by the volume. Finally, you divide the result by the day’s total volume, leaving you with your VWAP.
To really hammer this home, we’re going to find the VWAP for the hypothetical stock CVPS. Its first half-hour went like this:
| Time Period (5 min.) | High ($) | Low ($) | Close ($) | Volume (Shares) |
|---|---|---|---|---|
| 9:30 to 9:35 | 50.10 | 49.90 | 50.00 | 15,000 |
| 9:35 to 9:40 | 50.30 | 50.00 | 50.20 | 20,000 |
| 9:40 to 9:45 | 50.20 | 49.90 | 50.10 | 17,000 |
| 9:45 to 9:50 | 50.70 | 50.30 | 50.50 | 23,000 |
| 9:50 to 9:55 | 50.80 | 50.50 | 50.60 | 19,000 |
| 9:55 to 10:00 | 51.00 | 50.70 | 50.90 | 28,000 |
Time to plug this info into that dandy formula up there! For the first row, we add $50.10, $49.90, and $50.00 together (equalling 150) and divide it by three to get $50. We put $50.00 in for the Typical price, 15,000 for the volume and the cumulative volume since it’s the start of the day, and we get this:
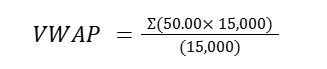
Crunch the numbers and we get $50.00. If we do the same thing with the second row, we get $50.10, then $50.09 for the third, $50.21 for the fourth, $50.30 for the fifth, and $50.43 for the sixth. If doing these sort of calculations isn’t your thing, a program like TradingView can help, as it lets you display the VWAP for your chosen stock with green and blue lines like in the screenshot below:
How is VWAP Typically Used In Trading?
This math is all well and good, but how is VWAP useful for traders? It enhances your trading decisions in plenty of ways, so let’s get down to it.
The Dynamic Duo of Support and Resistance
In one regard, VWAP is great at serving as both support and resistance levels. (A concept you can learn about in another one of our Workshop articles.)
Maybe a security is on the way up and heads back down to the VWAP – traders may see if it bounces off the VWAP (then serving as support) and heads higher. On the opposite side, if a security is headed down and swerves back to the VWAP, they may see if it bounces off the VWAP that’s now serving as resistance, and plunges back downward. Since the VWAP can be both the resistance and the support, it becomes a pretty unique and dynamic level to measure with.
When to Enter and When to Exit
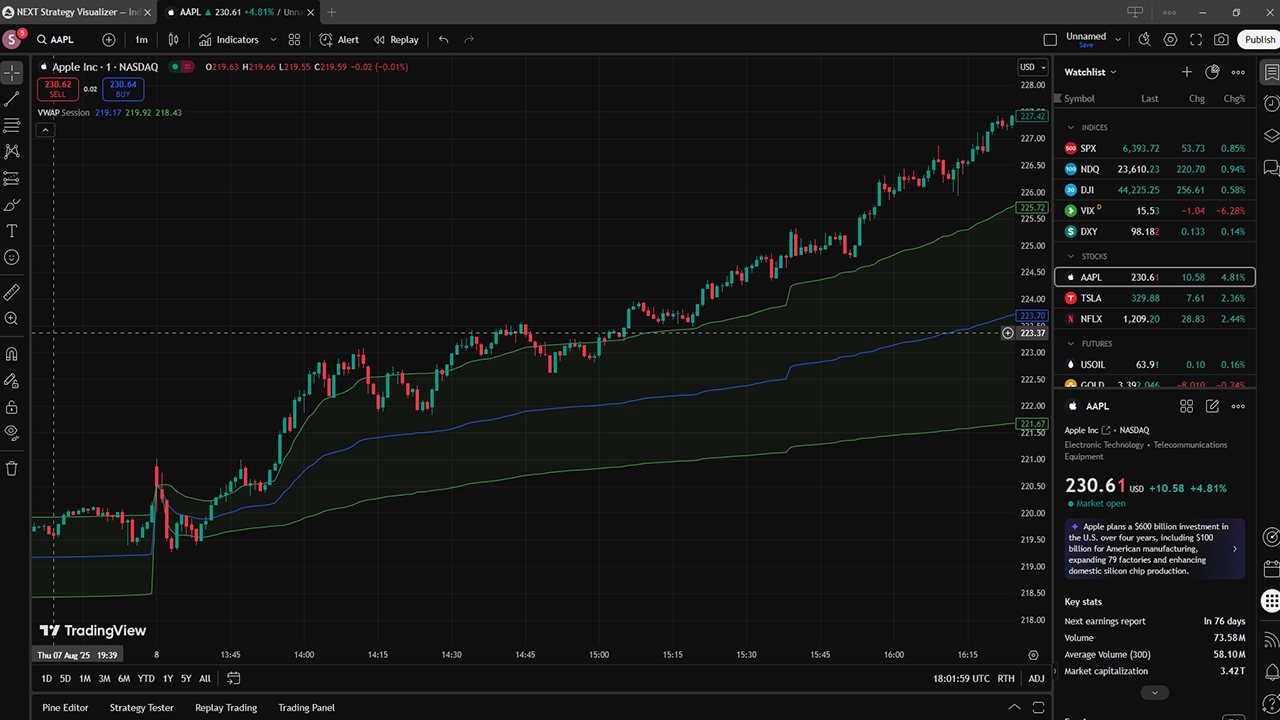
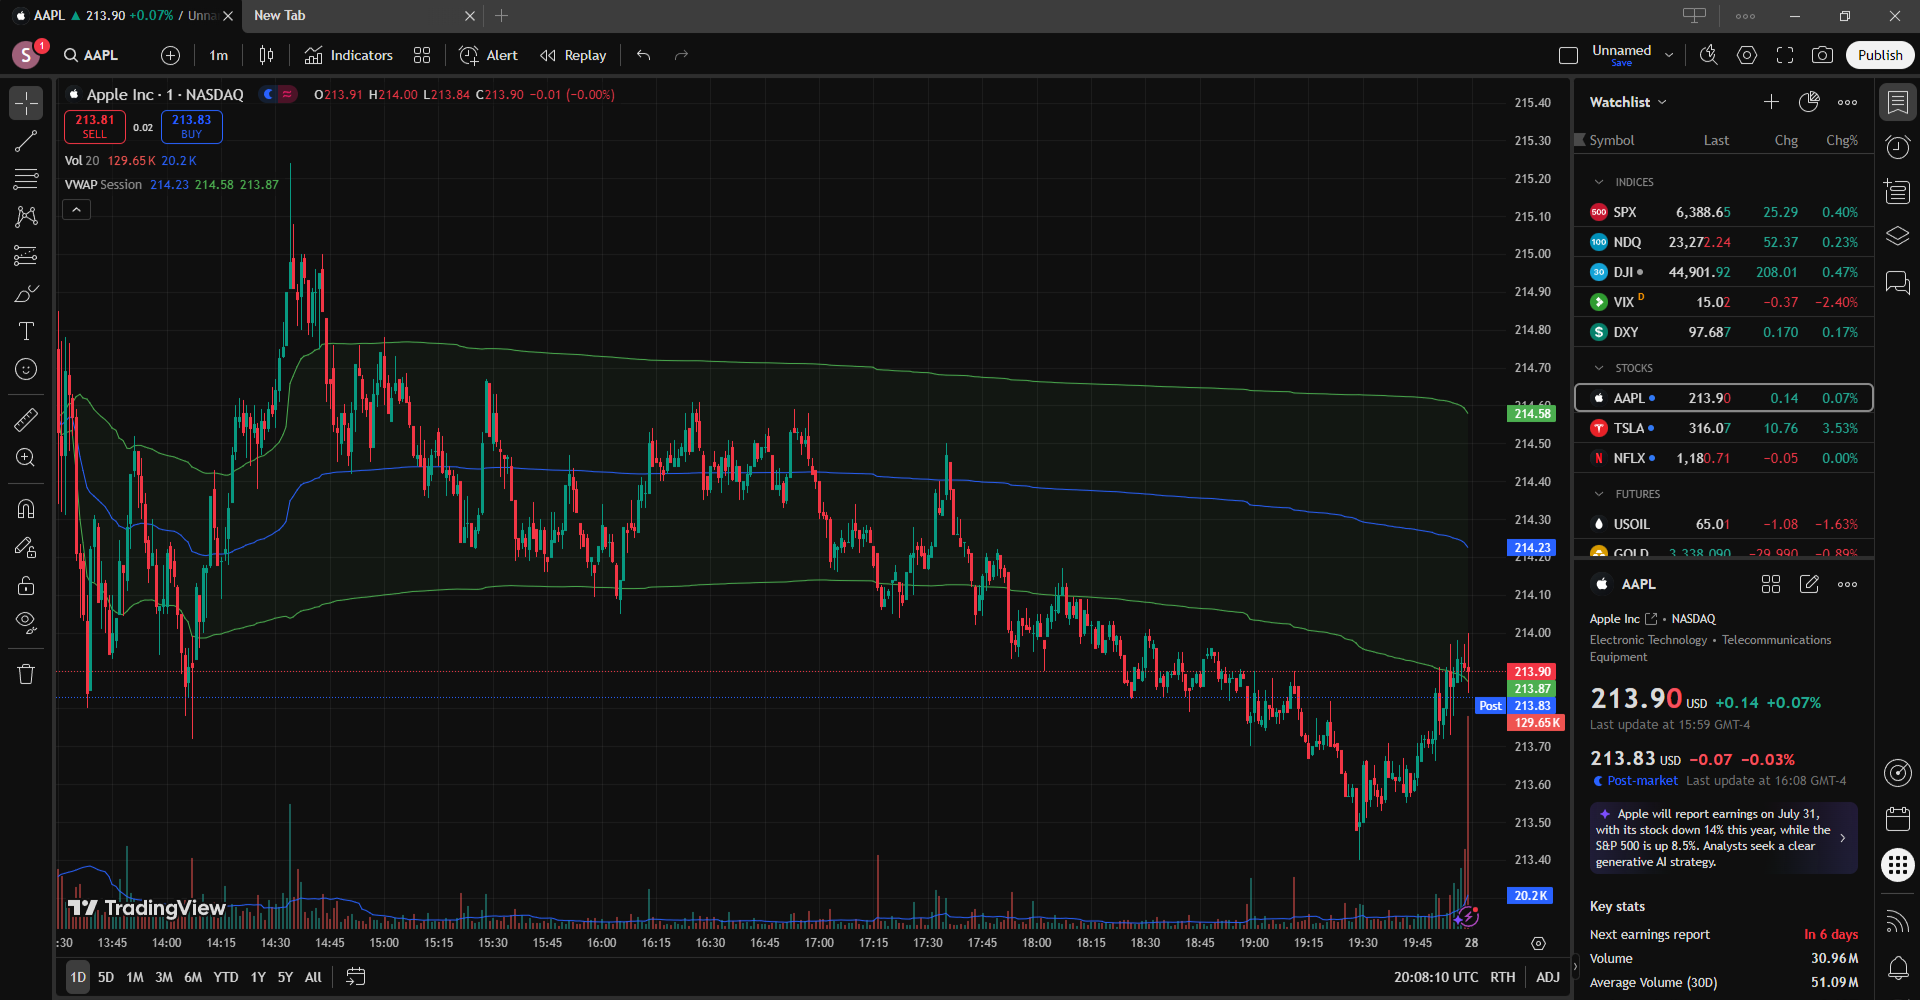
VWAP provides solid entry and exit signals, too. For entry, take a look below, where AAPL has gone significantly below the VWAP line before moving back up towards it around 17:00 to 18:00. Once it crosses the VWAP, that indication of a strong rebound towards the average could be a solid signal to buy.
As for exit, look above at 15:00 to 16:00 and how AAPL’s price starts to fall and crosses the VWAP after a strong rise. This could be a bearish signal and signal to a trader that it’s time to exit on a long position.
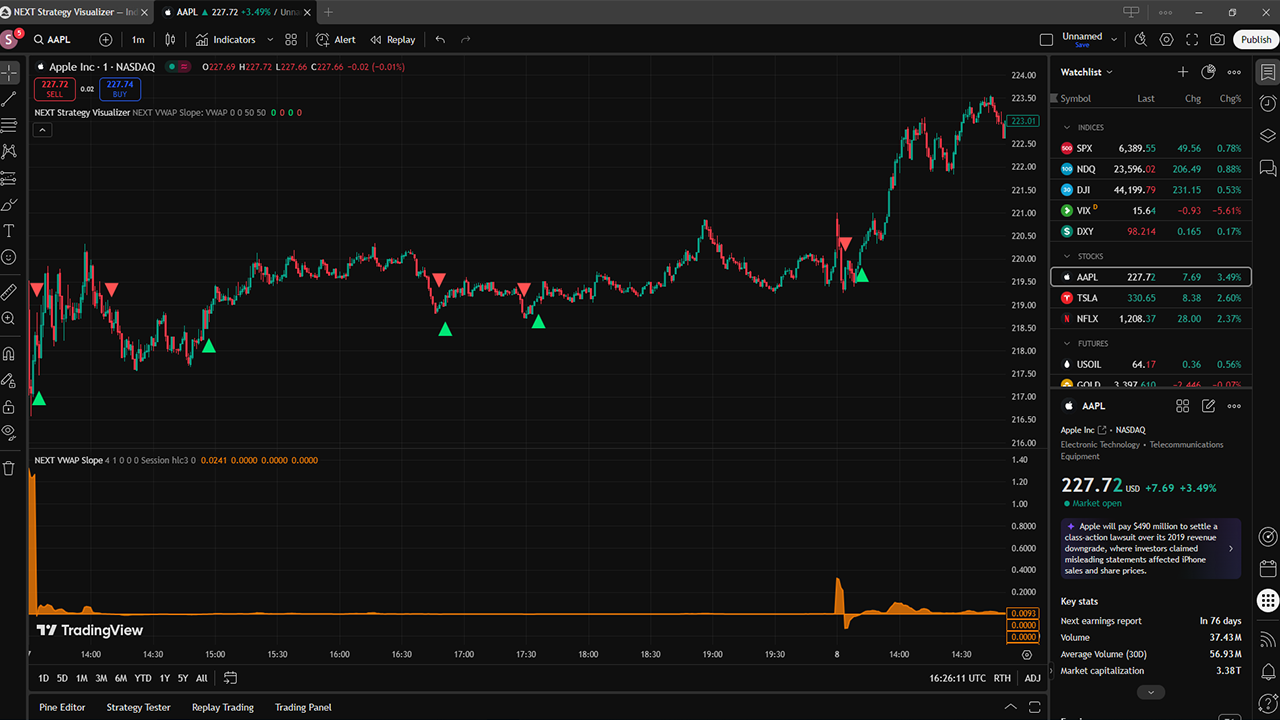
Additionally, check out ChartVPS’ NEXT VWAP Slope script being used alongside the NEXT Strategy Visualizer in the TradingView chart above. This is a highly responsive and customizable oscillator that tracks the slope of the VWAP line over whatever distance you decide on. It’s great for issuing long and short signals and exit signals at positive and negative extremes. We recommend adding it to your TradingView charts to easily track the positive and negative slope of the VWAP line.
Anyway, no two traders are the same, but these are some of the ways in which traders could use VWAP to gauge when the best time to buy or sell might be.
Fantastic Trends and How to Find Them
It is also a fantastic tool for trend identification. If a security’s price is frequently below the VWAP, that could mean the trend is downward, as sellers are in control of the price. Or, should the security’s price be climbing consistently above the VWAP, that could signal an upward trend with buyers primarily being at the wheel.
It could even identify a sideways market if the price is hovering near the VWAP for a good while. Simply examining the price of security in relation to the VWAP can tell you a lot about what might happen, which often proves to be an incredibly handy feature for any trader.
What Are the Whales Up to?
Finally, major institutional investors often look at VWAP as a sort of benchmark. They want to buy below VWAP and sell above it, as this means they’d be getting solid prices in comparison to the average for the market. VWAP represents the average since it takes volume into account, and through the formula we discussed a few points back, is able to calculate an average of the actual economic transactions rather than just the average of price points.
It also makes for less of an impact on the market if they’re making large orders. Typically, when someone makes a large order (for example, a large buy market order), it grabs shares for the lowest price at first before moving on to the next price bracket up, continuing like so until the order is complete. This pushes up a price through devouring the lower-priced shares. Meanwhile, using a VWAP algorithim for your order will execute orders in proportion to the market value, allowing it to blend in among other trades better.
This process even gives smaller traders something to measure their own choices by, as they can check out what the whales are doing and compare their own buying and selling habits.
Key Takeaways
VWAP is useful in plenty of ways, but its ability to serve as both a dynamic support and a dynamic resistance, its trend-identifying qualities, its impressive entry and exit signalling ability, and its use as a benchmark for smaller traders to compare themselves to bigger institutions stand out as some especially incredible benefits.
What’s the Difference Between VWAP and Moving Averages?
Well, first, I’d say we should define Moving Averages!
- Moving Average (MA): An indicator that levels out fluctuations of a security over a set period of time to find a discernible trend. It does this by taking the number of past data points (like days or hours) that you want to average and dividing the sum of prices for the number of periods by it. It’s frequently recalculated without being cumulative, as old data points are replaced by new ones.
The main thing that’s different between the two is that VWAP is volume-weighted, while Moving Averages aren’t. This leads to VWAP being a bit more responsive when it comes to high volume-based price movements. Additionally, VWAP is usually reset after a day, while moving averages typically cover much wider periods of time.
But what’s responsiveness in relation to price indicators? Basically, a responsive indicator quickly and sharply reacts to changes in price action, while a lagging indicator takes longer to react to changes. That’s not to say that one is bad and the other is good — both have their uses in certain situations.
Some responsive indicators include On-Balance Volume (OBV) and the Hull Moving Average (HMA), while things like Moving Average Convergence Divergence (MACD, which we cover in another Workshop piece,) and the Average Directional Index (ADX) are lagging indicators.
On the other hand, VWAP isn’t predicting where a price is headed, as being weighted by volume means it’s just confirming the current status. Also, the accumulating volume throughout the day makes VWAP less capable of fast changes the longer the day goes on. That being said, it still shows where you got your price fill when compared to the day’s average execution price. These conditions are certainly worth keeping in mind, as both VWAP and Moving Averages have benefits, which are displayed in the table below:
| VWAP Pros | MA Pros |
|---|---|
| Factors in volume | Easier for beginners to use and understand |
| Finds trends in a day | Can analyze trends over any timeframe |
| Serves as dynamic support and resistance levels | Filters out market noise |
And Then There’s MVWAP
I know we’re knee-deep in acronyms already, but I’ve got one more neat one for you: MVWAP, or the Moving Volume-Weighted Average Price. This one somewhat combines the two aforementioned concepts, spanning further than just a day to find the average of VWAP calculations over several days. Say you have ten days’ worth of VWAPs, then you’d just find the average of those to get the MVWAP.
MVWAP usually covers more expansive periods of time and produces a smoother long-term average when compared to VWAP, though it’s also less responsive in the short term since it’s covering so many daily trends. It’s frequently used in similar ways to VWAP, such as to figure out trends (in the longer term) or to act as a dynamic support/resistance level.
Having the MVWAP is often beneficial, as it doesn’t really have an endpoint. You can keep using it as time goes on to flexibly get the average of your VWAPs, while it won’t get hung up on one specific period as it goes on.
Closing Thoughts
VWAP is massively important when it comes to technical analysis. It can be used to find the best entry and exit points, to see how the market feels about certain securities, and to serve as a benchmark for how the major investors are thinking and trading. It’s something that you never want to underestimate, as it’s not just a line on a chart — it’s a benchmark that can empower you to buy or sell at the best price. Use it to gain that crucial edge in your trading, and you won’t regret it.