


How Fibonacci Analysis Can Detect Support and Resistance
We’ve gone over a few different indicators and trading analysis techniques here at the Workshop, but the Fibonacci Sequence (and, subsequently, Fibonacci Analysis) stands out from the rest. It’s one of the more fun ones to play around with, and it has a basis in more of the world than you might be expecting!
Core Fibonacci Concepts
Fibonacci Analysis is a mathematical concept that is used as a technical analysis method. Some could see it as a bit complex — not to worry, though, as we’ll be walking you through it in a nice and simple manner, regardless of your experience!
What is the Fibonacci Sequence?
The Fibonacci Sequence itself is easy enough to understand, though it’s not a major aspect of trading. It’s basically a list of numbers, with each number after the first being the sum of the previous two. So, starting from 0, it would be as follows:
So those are the numbers themselves, but that leaves us with a pretty big question: why do markets so often react at levels that come from the Fibonacci sequence?
The Fibonacci Sequence and the Market
The two main things that can explain why markets tend to react at Fibonacci-derived levels are psychology and a confluence of signals.
The Golden Ratio in Culture and Nature
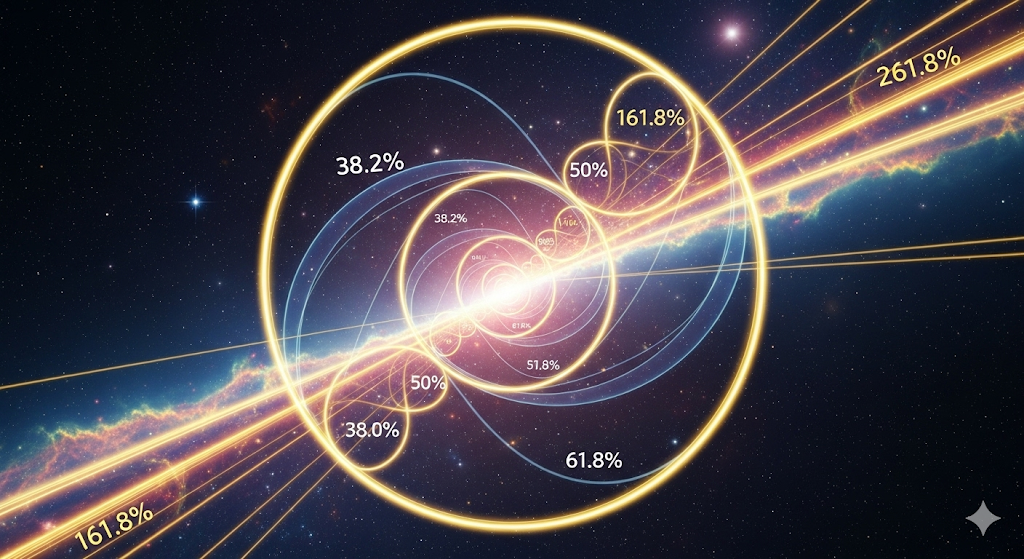
The Golden Ratio, also known as phi (ϕ), is a wildly important ratio to Fibonacci Analysis. It’s approximately 1.618, while its even more important inverse is 0.618, or 61.8%. Interestingly, the ratio often appears in nature in a visual form, with the concept even popping up in fictional stories like JoJo’s Bizarre Adventure: Steel Ball Run and Sakamoto Days:

Even outside of fiction, you’d be surprised at how often it appears in nature and art. In architecture, some historians claim that the Notre-Dame de Paris cathedral was designed with the golden ratio, while it’s even claimed that the Great Pyramid of Giza shows off the golden ratio.
In art, it can be seen in Vincent van Gogh’s Starry Night and in Katsushika Hokusai’s The Great Wave off Kanagawa. It’s even found in things that aren’t manmade, like spiral seashells and even the human body. It’s an incredible thing, especially since it can be applied to economics just as naturally as it can be applied to all of these other things!

The Golden Ratio in Trading
Now, let’s break down the mathematical concept! It goes like this: if you divide a number from the Fibonacci Sequence by the number before it, the resulting number will get nearer and nearer to 1.618 itself. For example:
As you can see, the further down the sequence you go, the closer to 1.618 you get! It’s a neat trick, isn’t it?
But how is it used in trading? Time to dive in! The Golden Ratio is typically used in Fibonacci retracements and Fibonacci extensions. Let’s start with retracements!
Fibonacci Retracements
At the core of the concept, Fibonacci Retracements, following a major price move, retrace the predictable part of said move before heading back in the original direction. Before we go into how we do this, we’ve got to take a gander at the most common retracement levels!
The Most Common Ratios
When it comes to the most common retracement levels, these are the ones that identify support and resistance areas with horizontal lines. In ascending numerical order, the most common ratios are:
- 23.6%
- 38.2%
- 50.0%
- 61.8%
- 78.6%
These percentages show how likely it is that a price move will retrace. We can use them to find the support and resistance levels.
Finding Support and Resistance With Retracements
First things first, you’ve got to find a big price move, the swing high, and the swing low of said trend. From there, you draw the tool from the swing low to the swing high, or vice-versa if it’s a downtrend. Then, the horizontal lines you draw at the aforementioned key percentages will show where the security’s price could find resistance or support.
Since so many traders use these rules and levels, retracement acts as a sort of self-fulfilling prophecy, as all that buying and selling strengthens the existing patterns by making the price react at those very points.
Retracements With Trendlines and Moving Averages
Retracements are often used with trendlines and moving averages – this is called confluence, or the use of more than one indicator to confirm one result. Let’s start with trendlines!
Using Fibonacci Retracement with VWAP
We’ve talked about VWAP in the Workshop before (and you can give yourself a refresher course if you’re feeling like learning), but we didn’t really get into how Fibonacci Retracement can go hand-in-hand with VWAP. Well, there’s no better time to do so than now!
As was the case with moving averages and trendlines, you’re looking for a Fibonacci retracement level to line up with a VWAP line. If a security’s price were to go back and hit the 61.8% Fibonacci level, with the VWAP at the same spot, this is a strong signal – better than either of the signals by themselves!
Fibonacci Extensions
The Common Ratios of Fibonacci Extensions
As you might expect, there are common percentages with Fibonacci Extensions, just like with Retracement. These are:
- 127.2%
- 161.8%
- 261.8%
Finding Support and Resistance With Extensions
First off, you’re going to need to find a powerful and clear impulse wave that is, very importantly, supported by volume. Once you’ve found a strong uptrend or downtrend, make sure the volume lines up with their direction. Preferably, the volume should be even higher than the average was in the previous period. Finally, confirm that there’s a shallow and straightforward retracement against the trend on lower volume, as this indicates the pullback as simply being a short-term weakness.
This is when you can apply the Fibonacci Extension tool at three points: the start of the trend, the end of the trend, and the end of the retracement. This makes the tool project levels (such as 127.2% and 161.8%) past the second point, creating potential support and resistance levels for the future.
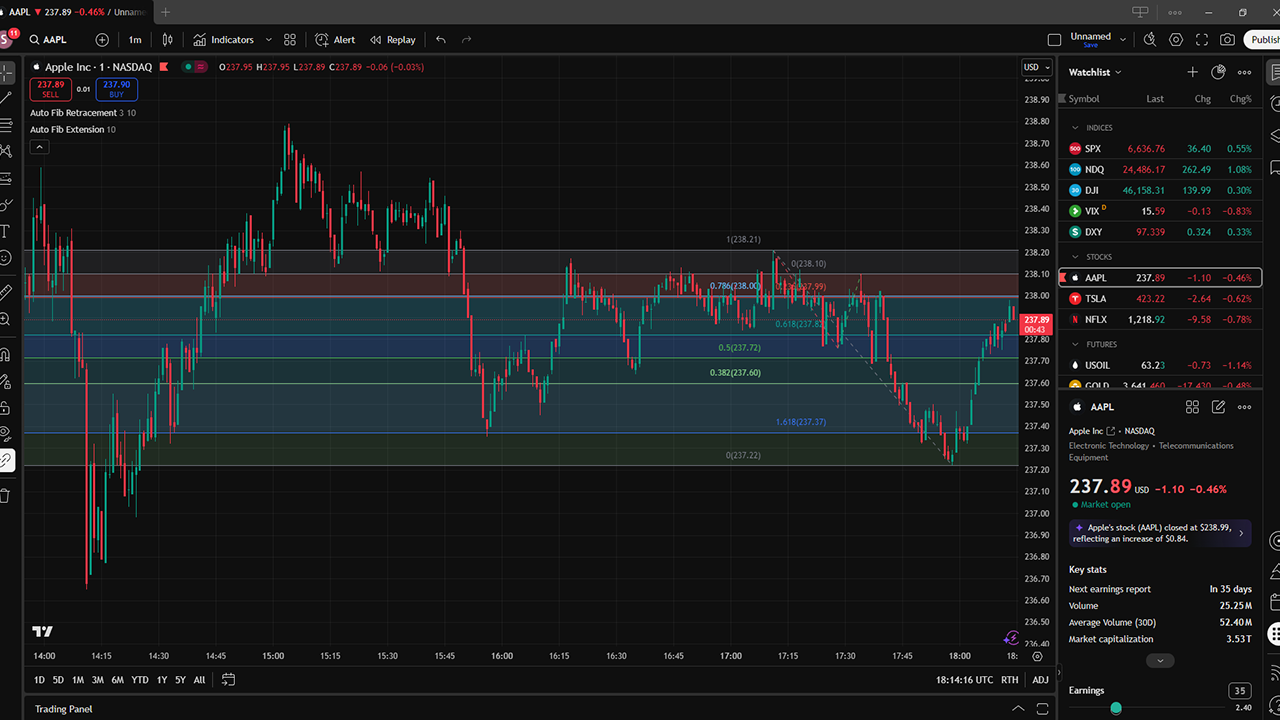
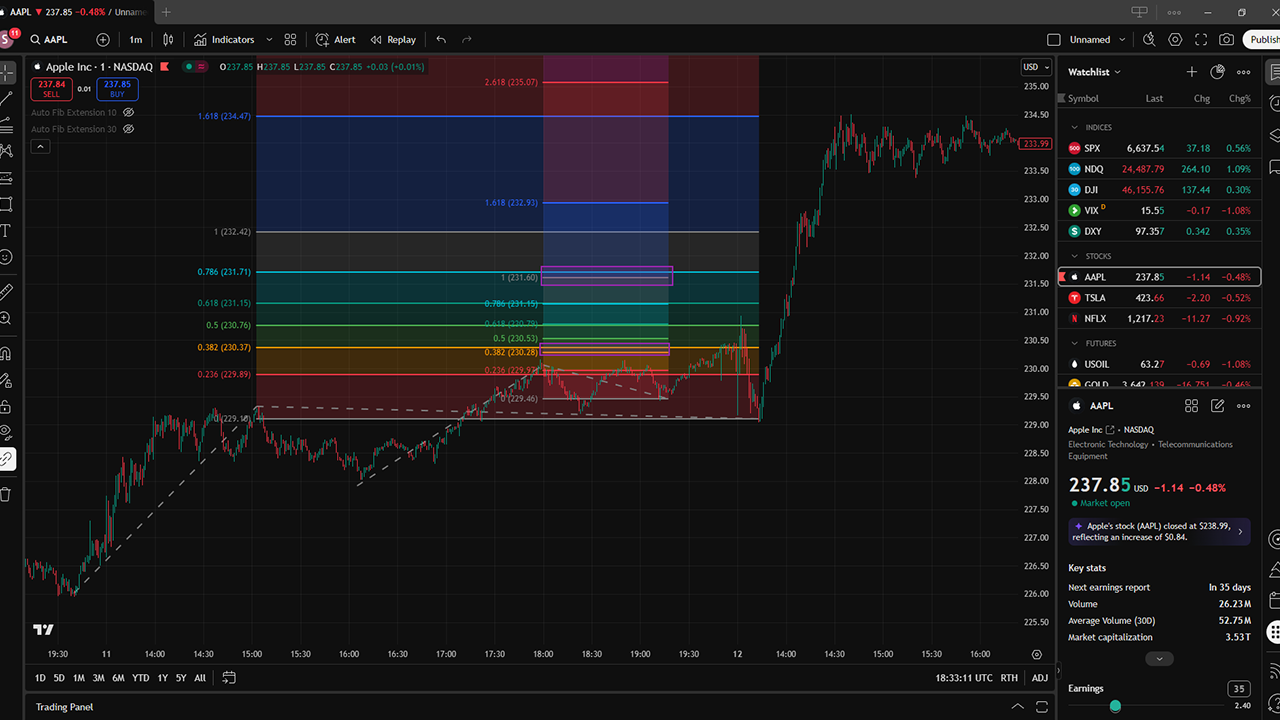
As is the case with many techniques and indicators, those of you who are using TradingView can easily add Fibonacci Extensions and Retracements to your charts, with even free members being able to add both within the two-indicator limit. You can see both of them on the AAPL chart below:
Using Fibonacci to Analyze the Future
Fibonacci extensions can even find price targets in trending markets! When a trend’s been set and finished a pullback, it’s time to identify three points: the start of the trend, the end of the trend, and the end of the retracement. Once you’ve gathered these three things, you’ve got to apply Fibonacci extension, and from the end of the retracement, you get horizontal lines at key extension levels. These lines are top-notch tools, giving possible price targets and signifying where things might reverse, pause, or slow down. Just like that, you’re something of a price oracle!
Projecting Breakout Legs With Fibonacci
You can project breakout legs in a pretty similar way that you can find price targets with Fibonacci extensions. When a security breaks out of a certain trading range, this tool figures that the trend’s next leg is related to the length of the previous one through math. It requires another three-point swing: the start of the initial move, the end of the initial move, and the end of the consolidation. When you apply the Fibonacci extension across these, you get horizontal lines that give you possible profit targets and resistance levels for the new leg.
How to Map Multiple Extension Confluences
Finally, Fibonacci extensions can be used to map multiple extension confluences. In short, you use more than one extension on one chart to find the best future price targets. To do this, you have to find a couple of price swings that are actually part of a bigger trend – the first and second swing, with the second being a bit shorter than the first. Throw the Fibonacci extension tool onto both, and you’ve got two sets of price targets. Now just look for places where these two sets overlap, and you’ve got confluence zones!
Conclusion
Now you can see why Fibonacci analysis can be such a powerful tool when it comes to trading! It can find support and resistance, be used in conjunction with everything from VWAP to trendlines when it comes to retracements, and secure price targets in trending markets through extension. It’s an agile strategy that can stand among the best trading has to offer – even nature uses it, which is a pretty good indication that there’s got to be something to it.