


Everybody Do the Volatility Squeeze
When you’re sizing up a security with the intention of making a move, almost any piece of information can help. A volatility squeeze is one more tool to give you a three‑dimensional look at price action: less about predicting the future and more about framing likely scenarios. If that sounds bold, read on: the logic is solid.
What is a Volatility Squeeze?
Before diving in, a quick note on the word squeeze. In markets it can mean different things (e.g., short squeeze, liquidity/credit squeeze). Here, we’re talking about volatility – specifically, a period when price ranges contract and the market goes unusually quiet.
This contraction often precedes a large directional move or a shift into higher volatility. Think of it as a coiled spring: energy builds while price compresses, then releases.
Why is a Volatility Squeeze Useful?
Traders benefit from knowing where breakouts are more likely. Squeezes spotlight zones of compression that frequently resolve in expansion. That doesn’t guarantee direction, but it can improve timing and help you position for movement, especially when combined with context (trend, support/resistance) and confirmation (volume, momentum).
How Do You Find a Volatility Squeeze?
The most common practical approach pairs Bollinger Bands (BB) with Keltner Channels (KC). To understand them, it helps to review Standard Deviation and Average True Range (ATR).
Standard Deviation
Standard deviation measures how far individual price points stray from their average.
- High standard deviation: prices are widely spread – bigger swings.
- Low standard deviation: prices cluster near the average – smaller swings.
Bollinger Bands use this property dynamically. They’re typically plotted as a Simple Moving Average (SMA) with bands ± k standard deviations (often ±2σ). When volatility contracts, the bands narrow; when volatility expands, the bands widen.
Average True Range (ATR)
ATR estimates typical price range over a lookback period, accounting for gaps. It’s great for gauging current volatility and for validating breakouts:
- Rising ATR on a breakout suggests expansion (the “squeeze is releasing”).
- Flat/falling ATR on a breakout can hint at a false move.
ATR also defines the width of Keltner Channels.
Bollinger Bands
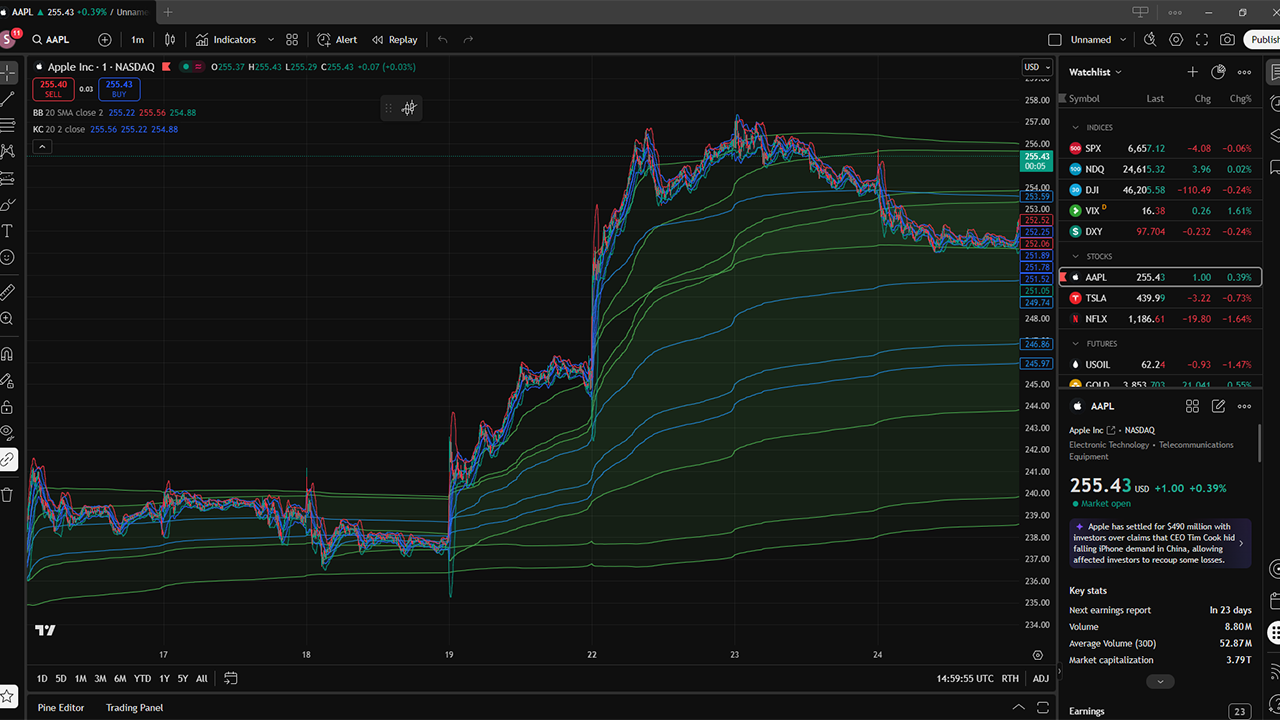
Bollinger Bands (commonly 20‑period SMA, ±2σ) wrap price with a volatility‑responsive envelope. During a squeeze, the bands contract sharply toward the SMA, signaling low volatility and a tight trading range.
Keltner Channels
Keltner Channels are similar in spirit but use ATR for width and typically an EMA as the center line (e.g., 20‑EMA with ± 1.5×ATR). Because ATR smooths extreme spikes, KCs are often less jumpy than BBs.
BB and KC: Together at Last!
A classic squeeze setup occurs when the Bollinger Bands move inside the Keltner Channels. That tells you standard deviation (BB) has contracted so much it fits within the ATR‑based envelope (KC) – i.e., volatility is compressed and poised to expand.
Common starting settings (adapt as needed):
- BB: 20‑SMA, ±2σ
- KC: 20‑EMA, ±1.5×ATR
- Squeeze condition: BB inside KC
You can apply both indicators in TradingView (or similar) and, if you prefer, use a “squeeze” script (often called TTM Squeeze) that flags the BB‑inside‑KC condition and plots momentum – handy for scanning.
What Do You Do When a Volatility Squeeze Happens?
Most traders wait during compression and act on expansion. A simple workflow:
- Define the range. Mark the recent highs/lows formed during the squeeze.
- Wait for a trigger. Examples:
- A close above the upper band/channel or below the lower band/channel.
- A range break (price closes beyond the squeeze high/low).
- ATR uptick or a visible widening of BB/KC confirming expansion.
- Confirm. Look for supportive volume, rising ATR, or momentum alignment with the breakout direction.
- Manage risk.
- Place stops beyond the opposite side of the squeeze range or use ATR‑based stops.
- Size positions so a normal loss (e.g., 1–2×ATR) is acceptable for your plan.
- Consider scaling out into strength/weakness as volatility expands.
- Stay flexible. Squeezes can fake out; if confirmation fades, reduce risk or exit.
What Are Some Indicators That Are Also Used With Volatility Squeezes?
Because squeezes flag potential energy but not direction, confirmation helps.
On‑Balance Volume (OBV)
OBV cumulates volume on up vs. down closes. Rising OBV into/through an upside break hints at accumulation; falling OBV supports a downside break. Divergences (e.g., price up, OBV flat/down) can warn of fragile breakouts.
Volume Profile
Volume Profile shows where shares traded by price level (high‑volume nodes vs. low‑volume nodes). A tight profile with a clear Point of Control (POC) and adjacent low‑volume areas suggests consolidation. A breakout from that base can traverse low‑volume “air pockets” quickly, which aligns well with post‑squeeze expansion.
Conclusion
Volatility squeezes do a lot with a little. By spotting compression, you can prepare for expansion and use confirmations (volume, ATR, momentum, market structure) to tilt the odds. Add disciplined risk management, and squeezes become a practical, repeatable part of your trading toolkit.