


AVWAP: A Whole New VWAP
Some of the indicators and methods we’ve examined here in the Workshop are more similar than others, but AVWAP and VWAP could be the closest to one another. It goes beyond the near-identical acronym, too! Here’s how:
What is AVWAP?
A big hint comes from the name – Anchored Volume Weighted Average Price. In case the bolding wasn’t enough, remember that the word “Anchored” is the key thing here. It means that this version of VWAP is quite literally “anchored” to a very specific point in time that you yourself, as the trader, have to choose.
The calculation process is the same as VWAP, but that starting point is what really matters here. Before we get into the nitty-gritty, though, let’s take a gander at what makes for a good anchor point!
What Sort of Things Make for a Good Anchor Point?
You’d figure that if you’re going to anchor VWAP to a point in time, it’s got to be tied to something pretty significant. In that regard, you’d be right! Here are some of the key things that serve as solid anchor points:
- The start of the year
- The start of a trend
- An important swing high/low
- A big news event (for example, an earnings report related to the security)
You can see why these things would serve as important points in time when it comes to a security. Of course, there are plenty of other things that could serve as equally strong anchor points, but it all comes down to how they’d affect your chosen security.
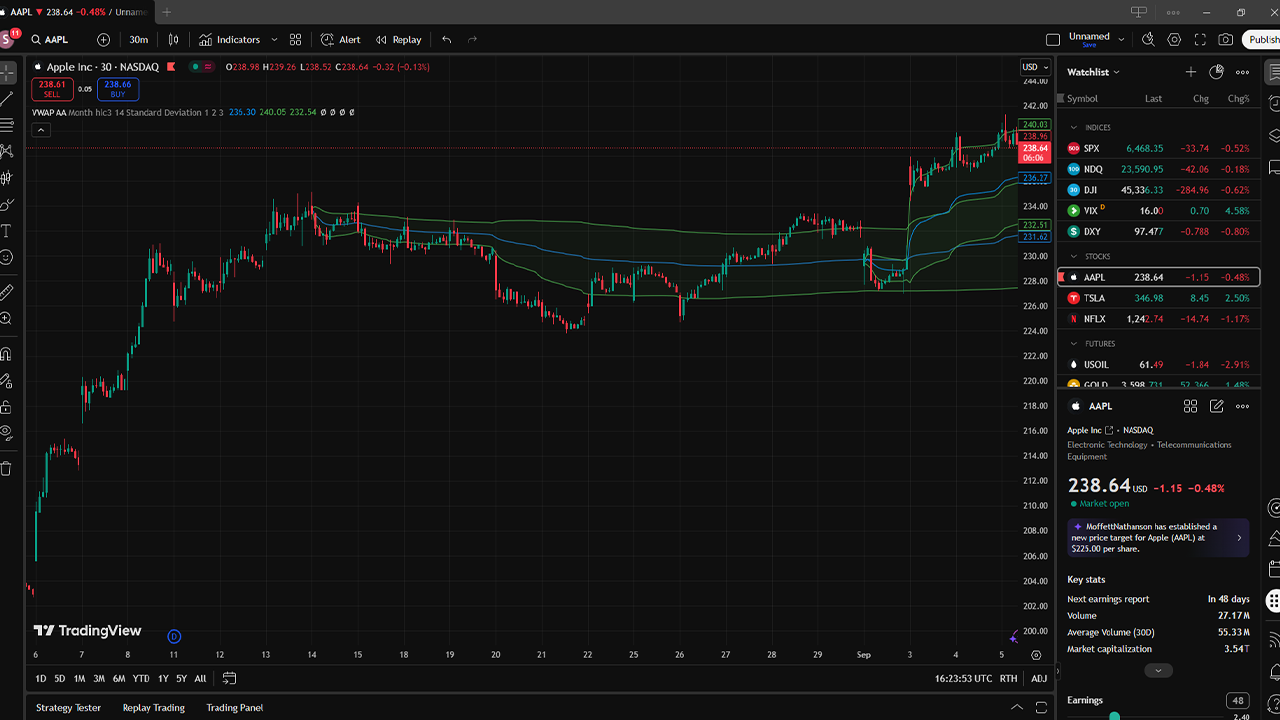
You can see an example of AVWAP (anchored to the August high for AAPL) in TradingView below:
How is AVWAP Used in Trading?
One of the most common ways it’s used is to find major support and resistance. In an uptrend, the AVWAP line can serve as a solid level of support, while in a downtrend, it can be a strong level of resistance. And if the price of a security were to pull back and hold at the AVWAP line, that could signal that the trend is set to continue.
Then there’s the other primary way AVWAP is used: to figure out a trend’s health. Let’s say you anchor the AVWAP to the beginning of a trend – it becomes incredibly easy to see whether the security’s price is trading above or below its starting point. If you trade below that AVWAP point, you can figure that the trend is getting weaker, while on the other hand, trading above it would mean that it’s likely in a pretty profitable spot.
AVWAP is also great for stop placement when it comes to trades that cover a number of different days. If you were to anchor the AVWAP to a post-major sell-off’s low, then it would be a great support level. Should it dip under the anchored line, it shows that the trend could be headed to a major breakdown, making it a great signal to stop and get out.
Finally, it can figure out if the market has a risk-on bias or a risk-off bias. Before you wonder what those are … well, I’m going to tell you. Risk-on bias means that buyers are in control of the market, which has been in an uptrend since your chosen event. As such, risk-off bias means the sellers are in control, likely pointing to an ongoing downtrend.
Making a Multi-Anchored Heat Map
From that explanation, you might be able to glean how to make a multi-anchored heat map with AVWAP. First, you find the key anchor points on your chart – go ahead and use the “good anchor point” examples a few steps back. Then, add several AVWAP indicators to the chart, with the anchor points being the points you identified at the beginning of the process. Change each line’s color and thickness to make them stand out, then look for places where the lines compound. This makes a heatmap effect, showing areas of exceptional confluence where a bunch of volume-weighted averages are aligned. Just like that, you’ve made yourself a multi-anchored heat map! You can do this on most modern trading platforms, like TradingView.
Similarly, the multiple AVWAP lines from your heatmap can also be used to make a “first close above all anchors” scanner. This is based on the idea that if a security’s price closes while above the bundles of AVWAP lines, the market is likely going from bearish to bullish. Like with many of the other uses, you’ve first got to set your chosen anchor points, be they highs, lows, or news events. The scanner is then programmed to look for securities that meet your criteria, such as a recent close above your cluster of AVWAP lines. When it finds a security that closed above the lines, it gives you a bullish entry point for a long trade. Most trading software doesn’t natively have this scanner, but you can build it using several AVWAP indicators, or even custom ones.
What are Some Comparable Indicators to AVWAP?
It’s always worth looking at comparable indicators when examining something like AVWAP, as it helps round out one’s understanding while also piquing interest on other indicators. When it comes to indicators that are like AVWAP, I’ve got two in mind: GMMA and Volume Profile.
Conclusion
AVWAP is an important indicator that stands apart from its contemporaries, even the similar VWAP. It’s a great tool for finding major support and resistance, as well as learning about a specific trend’s health. So long as there’s a major point in time to anchor it to, AVWAP can certainly carry its own weight in the trading arena.