How Accumulation and Distribution Can Give You the Trading Edge
Accumulation and Distribution are used all the time by traders to spot trends and to see what big institutions are up to. But how are they used in that way? And how do you calculate such wide concepts? Fear not – all these questions and more will be answered in today’s Workshop article. Let’s get to it, then!
What’s Accumulation?
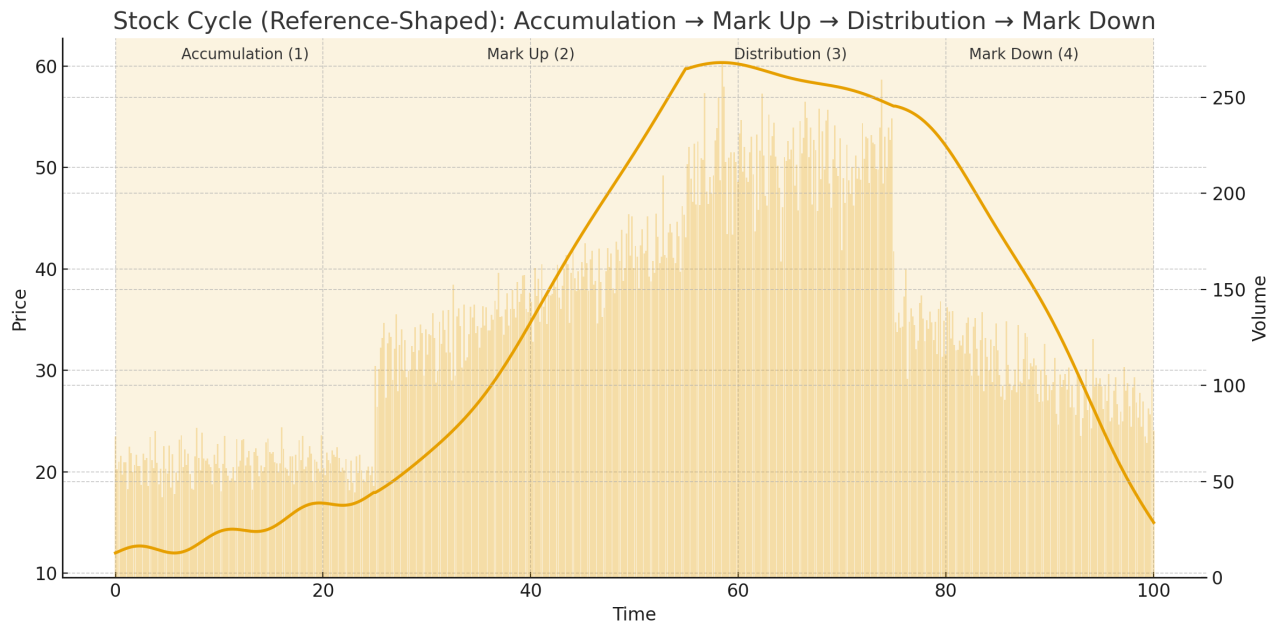
Put simply, accumulation is the phase of a stock’s trading cycle in which institutions steadily and subtly buy the stock. It could also be called the “bottoming out” phase, as it follows a long downtrend that has shaken off most buyers – the key word being “most!” This is where whales and smart money begin to quietly buy shares without making too much of a racket, leading the price to usually move sideways to form a solid base. This can be considered a bullish signal!
What’s Distribution?
So if accumulation is the phase that involves steadily buying, it only makes sense that its opposite – distribution – is a phase of steady selling from said institutions. This one is often also described as the “topping out” phase. The previously mentioned whales and institutions start selling their acquired stock to the masses, who are more than ready to buy them up. The price once again moves sideways, though this time, it’s because of the smart money selling meeting the public buying, as the resulting price rally gets the public interested. Think of it like this: the volume is high while the momentum is low. This can be considered a bearish signal!

Key Takeaways
Accumulation and distribution are two sides of one particularly important coin. The two concepts balance each other out, serving as the first and third phases of a stock’s life. The two opposites are both essential to the journey of a security, providing it with periods of steady purchases from smart money, as well as steady selling from those same institutions.
But How Are They Used in Trading?
The most well-known way that accumulation and distribution are used in trading is to anticipate future price trends. Since the accumulation phase involves selling pressure weakening following a downward trend, it can indicate an upturn in the near future. On the other hand, the distribution phase shows that a downtrend could be coming your way, as buyer interest could be waning.
Similarly, you can use accumulation and distribution to see what the “smart money” is up to. Like we covered while defining the two terms, the whales are typically buying during the accumulation phase and selling during the distribution phase. This means that by looking for these signs of what the institutions are up to, you can figure out exit positions ahead of the curve.
Walk the Accumulation/Distribution Line
Now then, it’s about time we talked about the Accumulation/Distribution line, also called the A/D Line for simplicity’s sake. Think of it as a running total of a volume-based calculation. The A/D line can confirm if strong volume is supporting a price movement.
Before pushing ahead, let’s take a quick look at how the A/D line is calculated. Be warned, we’re getting into a few consecutive math formulas here, as this is a three-step process:

Alright, so how do we get the Money Flow Volume?

Fair enough, but how do we get the Money Flow Multiplier?

Time to mix it all together! This will be easiest to portray with a handy example! I grew up with Sega, so let’s do it using Sega Sammy Holdings (SGAMY) as an example!
| High | Low | Close | Volume (Shares) |
|---|---|---|---|
| $50.00 | $48.00 | $49.50 | 1,000,000 |
Additionally, we’ll need the previous A/D, so let’s say that’s 10,000,000 for the sake of our example!
Anyways, first things first – we’ve got to find the Money Flow Multiplier. Using that formula up there, that leaves us with this:
From that, we get our answer of 0.50. Keep this result on hand, as we’ll be plugging that into the next step. It’s time to find the Money Flow Volume. That’s a little less complicated than finding the Money Flow Multiplier, as it’s just some simple multiplication:
Easy enough! This gives us 500,000. Finally, we’re at the formula you’ve really been waiting for: the Accumulation/Distribution line. Using our previous answer, and assuming the previous day’s A/D was 10,000,000, we get:
Add those together, and boom: the Accumulation/Distribution for SGAMY that day is 10,500,000! Do this again the next day, and so on, and you get a true Accumulation/Distribution line.
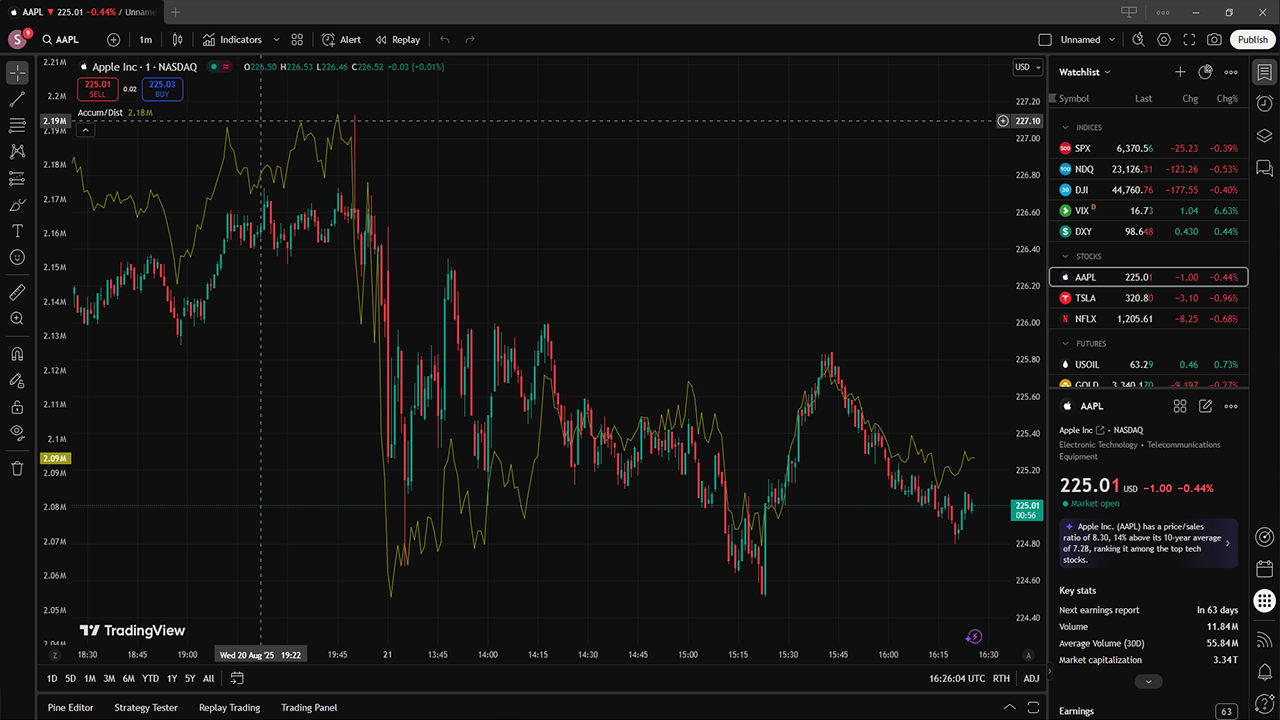
Alternatively, if you’re using TradingView, you can actually just set Accumulation/Distribution as an indicator on your chosen chart, making it easy to see the levels at any time on any security. Take a gander at the screenshot below to see how it looks in the program (it’s the yellow line):

The Good and the Bad of Accumulation/Distribution
As is the case with any indicator, there are benefits and downsides to using Accumulation/Distribution. Whether or not you feel one outweighs the other comes down to your trading style and what exactly you’re looking for in an indicator. With that in mind, let’s break down the positives and negatives so that you can make your own informed decision!
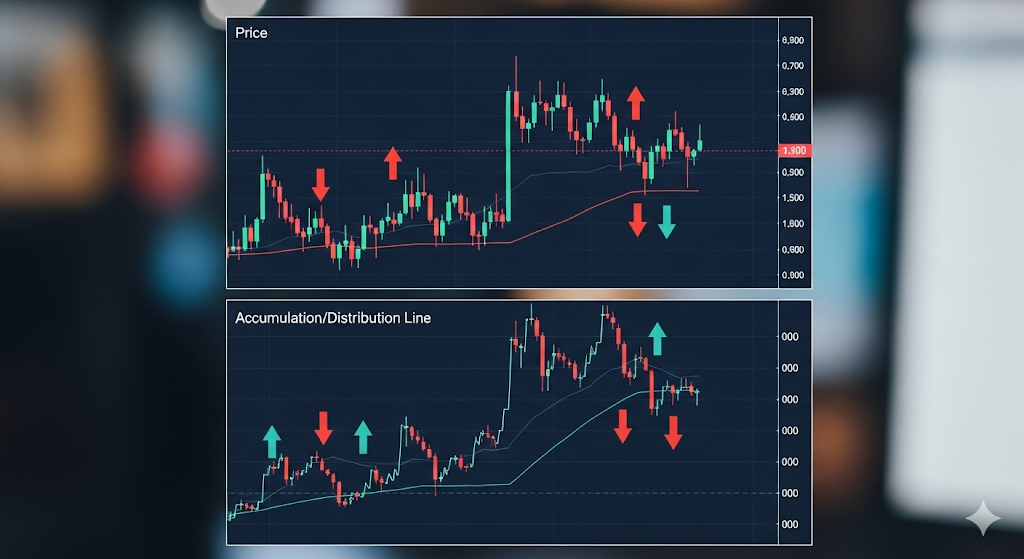
One major advantage is that the A/D line can warn you about a trend reversal. Let’s say the price of SGAMY is rising, but the A/D line is falling. This could be a signal that the buying volume isn’t supporting the seemingly strong uptrend, meaning a drop could be imminent. Plus, incorporating volume into things is what makes you able to assess what the bigger players might be doing.

As for disadvantages, a big one is the fact that since it’s based on the high, low, and close of a day, A/D can get messed up by big gaps in the price. (For the unaware, gaps are a break in the continuty of a security’s price, typically as the result of major news or happenings that take place outside of trading hours.) Also, the fact that A/D is cumulative means it’s not the best indicator for intraday trading. Finally, it’s a lagging indicator, meaning it reflects what has already happened.
If you want a quick visual reference, here’s a handy little chart highlighting the simplified advantages and disadvantages.
| Positives | Negatives |
|---|---|
| Can find divergences in a security | Lagging Indicator |
| Identifies Trends | Can be distorted by gaps |
| Can show what big money is doing using volume | Cumulative nature limits use in intraday trading |
Accumulation/Distribution vs. On-Balance Volume
If you’ve heard of On-Balance Volume (also known as OBV), you likely know that it’s got some similarities to Accumulation/Distribution. After all, they’re both volume-based indicators. (Another volume-based indicator was actually the subject of our last Workshop piece, if you’re in a binging mood!)
The major difference is that accumulation/distribution doesn’t take the previous close into consideration, instead focusing on the close relative to the security’s range based on the time period you’re looking at. Meanwhile, On-Balance Volume either adds or subtracts entirely based on whether the price closed lower or higher than the day before. The previous close is essential to OBV and completely irrelevant to A/D.
As such, OBV is primarily used to look for the daily price change, while A/D is all about where the close is in a day’s price change. OBV is therefore best for confirming straightforward trends or figuring out momentum, while A/D is about more subtle trends and changes.
What Complements Accumulation/Distribution?
Before we kick it out of here, it’s worth looking at a couple of indicators that work well with A/D. The two I’ve got on my mind are Money Flow Index (MFI) and Chaikin Money Flow (CMF).
For MFI’s part, it’s also volume-based and is used to figure out how strong a security is within a 14-day period. This one’s an oscillator with a range of 0-100, with 0 meaning the security is oversold and 100 meaning it’s overbought.
Then there’s CMF, which is presented as a percentage. It features similar data to A/D, but presented in a more straightforward way. This makes it easier to see the buying or selling pressure of a security, making it ideal for those who aren’t fond of the more complex indicators.
Both of these can be used well alongside A/D, creating a handy trio of indicators for spotting a security’s strength and pressure.
Closing Thoughts
That about wraps it up for accumulation and distribution! This powerful duo can help you anticipate trends before they unfold and can show you what the whales are up to when it comes to a specific security, making it an indispensable tool in your trading belt. Add in some complimentary indicators like MFI and MCF, and you’ve got a trifecta of indicators that you can truly rely on.


