The Approach
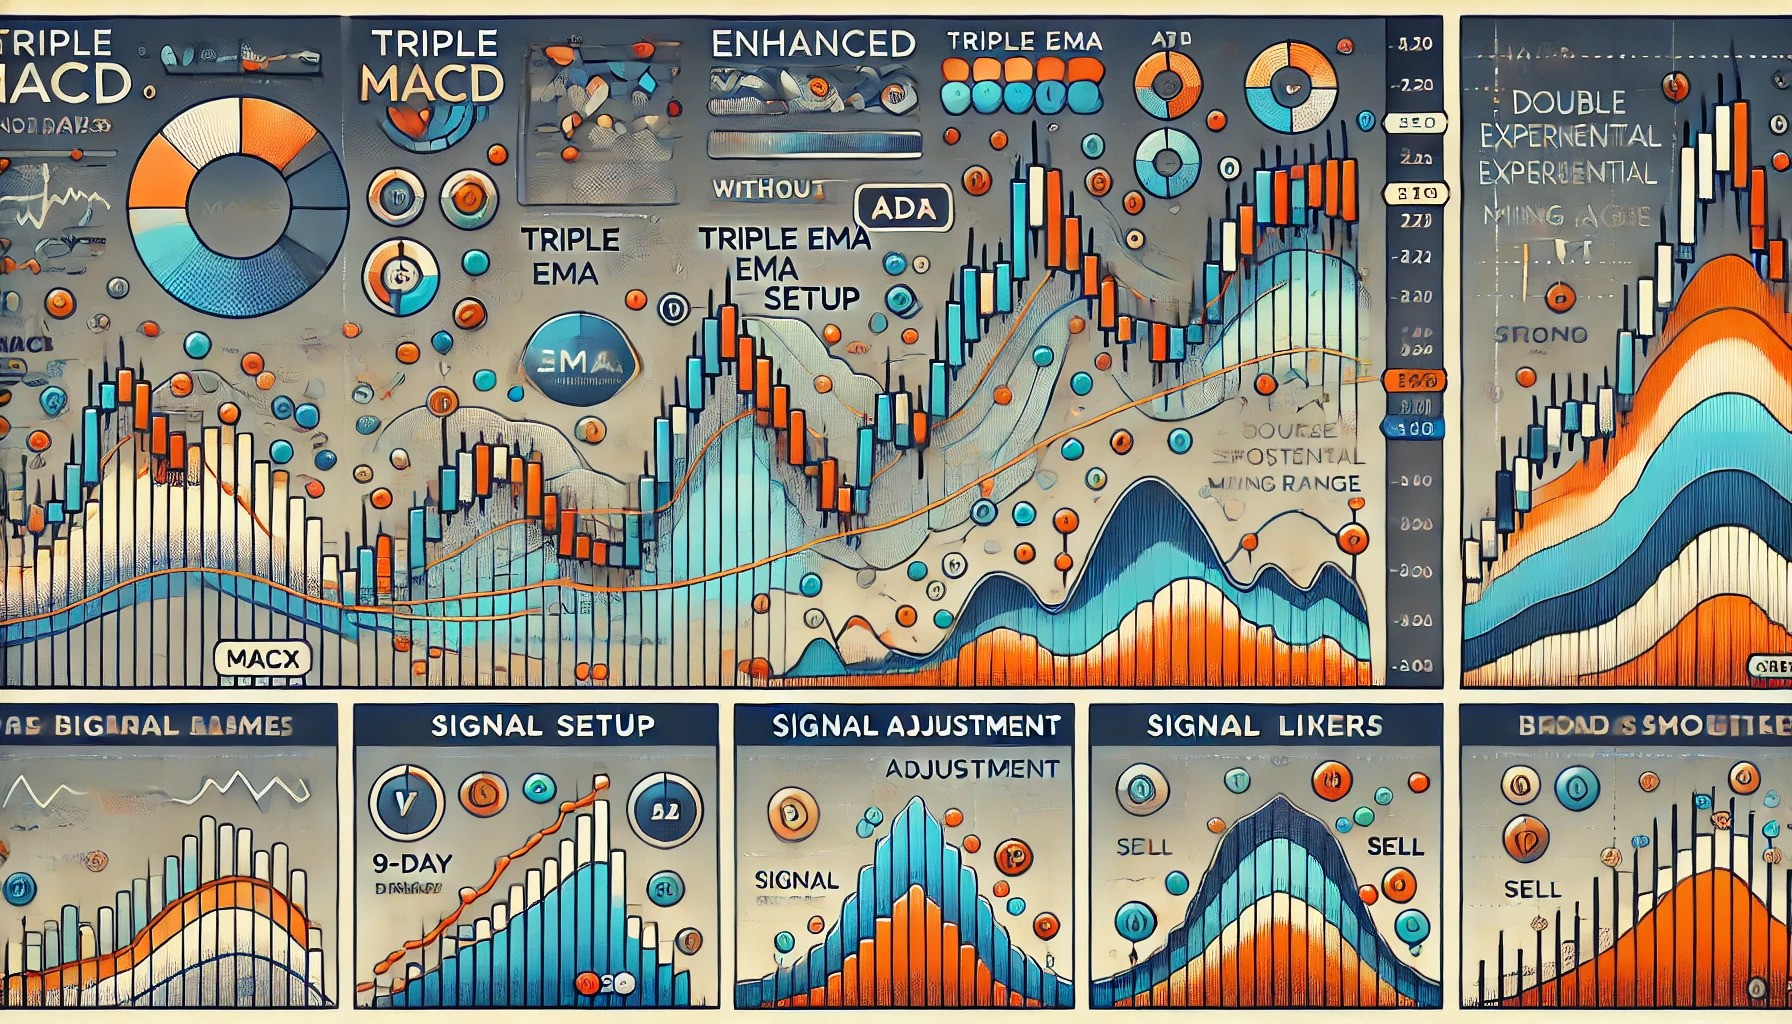
Howdy, y’all! Let’s rustle up a brand-new, turbocharged version of the MACD indicator that’s as sharp as a tack and twice as quick. We’re gonna make this here MACD sing by adding a triple EMA setup, volatility adjustment, signal smoothing, and a trend strength filter. Hold onto your hats, ’cause here we go!
-
Triple EMA Setup:
- We ain’t sticking to the standard 12-day and 26-day EMAs. Nope, we’re using three EMAs: 9, 21, and 50. This triple threat will give us a keen eye on short, medium, and long-term trends.
-
Volatility Adjustment:
- We’re throwing in the ATR (Average True Range) to adjust the sensitivity of our MACD line. This way, we can separate the wheat from the chaff and zero in on real price movements.
-
Signal Smoothing:
- To keep things smooth as molasses, we’ll apply a Double Exponential Moving Average (DEMA) to our MACD and Signal lines. This cuts the lag and gets us faster responses.
-
Trend Strength Filter:
- Lastly, we’ll wrangle the ADX (Average Directional Index) to filter out weak trends. Only signals with strong trends (ADX > 20) will be worthy of our attention.
TradingView Pine Script Implementation
Now, let’s get down to brass tacks and write this bad boy in Pine Script for TradingView:
//@version=5
indicator("Enhanced MACD", overlay=false)

// Input Parameters
emaShort = input(9, title="Short EMA")
emaMedium = input(21, title="Medium EMA")
emaLong = input(50, title="Long EMA")
signalLength = input(9, title="Signal Length")
adxThreshold = input(20, title="ADX Threshold")
atrMultiplier = input(1, title="ATR Multiplier")

// EMA Calculations
emaShortVal = ta.ema(close, emaShort)
emaMediumVal = ta.ema(close, emaMedium)
emaLongVal = ta.ema(close, emaLong)

// MACD Calculation
macdLine = emaShortVal - emaMediumVal
signalLine = ta.dema(macdLine, signalLength)
histogram = macdLine - signalLine

// ATR Calculation for Volatility Adjustment
atr = ta.atr(14)
adjustedMACD = macdLine * atrMultiplier / atr

// ADX Calculation for Trend Strength Filtering
adx = ta.adx(14)

// Plotting
plot(adjustedMACD, color=color.blue, title="Adjusted MACD Line")
plot(signalLine, color=color.red, title="Signal Line")
plot(histogram, color=color.green, style=plot.style_histogram, title="Histogram")

// ADX Filter
adxFilter = adx > adxThreshold
bgcolor(adxFilter ? color.new(color.green, 90) : na, title="ADX Filter Background")

// Buy/Sell Signals
buySignal = ta.crossover(adjustedMACD, signalLine) and adxFilter
sellSignal = ta.crossunder(adjustedMACD, signalLine) and adxFilter

plotshape(series=buySignal, location=location.belowbar, color=color.green, style=shape.labelup, title="Buy Signal", text="BUY")
plotshape(series=sellSignal, location=location.abovebar, color=color.red, style=shape.labeldown, title="Sell Signal", text="SELL")
Trading Strategy
And now, here’s our rip-roaring trading strategy, custom-built to take full advantage of our shiny new MACD indicator:
//@version=5
strategy("Enhanced MACD Strategy", overlay=true)

// Input Parameters
emaShort = input(9, title="Short EMA")
emaMedium = input(21, title="Medium EMA")
emaLong = input(50, title="Long EMA")
signalLength = input(9, title="Signal Length")
adxThreshold = input(20, title="ADX Threshold")
atrMultiplier = input(1, title="ATR Multiplier")
stopLossPerc = input.float(1.0, title="Stop Loss Percentage", step=0.1)
takeProfitPerc = input.float(2.0, title="Take Profit Percentage", step=0.1)

// EMA Calculations
emaShortVal = ta.ema(close, emaShort)
emaMediumVal = ta.ema(close, emaMedium)
emaLongVal = ta.ema(close, emaLong)

// MACD Calculation
macdLine = emaShortVal - emaMediumVal
signalLine = ta.dema(macdLine, signalLength)
histogram = macdLine - signalLine

// ATR Calculation for Volatility Adjustment
atr = ta.atr(14)
adjustedMACD = macdLine * atrMultiplier / atr

// ADX Calculation for Trend Strength Filtering
adx = ta.adx(14)

// Buy/Sell Signals
buySignal = ta.crossover(adjustedMACD, signalLine) and adx > adxThreshold
sellSignal = ta.crossunder(adjustedMACD, signalLine) and adx > adxThreshold

// Strategy Execution
if (buySignal)
    strategy.entry("Long", strategy.long)
    strategy.exit("Take Profit", "Long", limit=close * (1 + takeProfitPerc / 100), stop=close * (1 - stopLossPerc / 100))
if (sellSignal)
    strategy.entry("Short", strategy.short)
    strategy.exit("Take Profit", "Short", limit=close * (1 - takeProfitPerc / 100), stop=close * (1 + stopLossPerc / 100))

// Plotting
plot(adjustedMACD, color=color.blue, title="Adjusted MACD Line")
plot(signalLine, color=color.red, title="Signal Line")
plot(histogram, color=color.green, style=plot.style_histogram, title="Histogram")
bgcolor(adx > adxThreshold ? color.new(color.green, 90) : na, title="ADX Filter Background")
Explanation
- Triple EMA Setup: We use three EMAs to better capture different trend durations.
- Volatility Adjustment: By adjusting the MACD line with ATR, we enhance the indicator’s sensitivity to true price movements.
- Signal Smoothing: Using DEMA provides a smoother signal with less lag.
- Trend Strength Filter: The ADX filter ensures that we only act on signals with strong trends.
With this souped-up MACD indicator and strategy, you’ll be trading like a pro, cutting through market noise and honing in on the best opportunities. Just copy this Pine Script into TradingView, and let it ride!


