

You have spent the evening testing a strategy. The entries make sense, the drawdown looks manageable, and the results survive a few parameter changes. You open the trade list to look more closely.
There it is: a limit entry at the exact low, followed by a tidy exit. On another trade, both the stop and target were inside the same candle. The report has chosen a winner.
How did it decide?
That question deserves the same attention as the signal. A backtest combines your strategy, historical data, and rules for deciding when an order would have filled. An attractive result can depend on the third part more than you realise.
This is worth investigating while the mistakes are still inexpensive. You do not need to build an exchange simulator. You do need to know which assumptions are doing the heavy lifting.
One Bar Can Tell Two Stories
Suppose you are already long at 100, with a stop at 99 and a target at 101.50. The next bar opens at 100, reaches a high of 102 and a low of 98, then closes at 101.
Both exit prices were reached. Which came first?
The open, high, low, and close do not tell you. These two simplified paths produce exactly the same candle:
| Possible Price Sequence | First Exit Level Reached |
|---|---|
| 100, then 102, then 98, then 101 | Target at 101.50 |
| 100, then 98, then 102, then 101 | Stop at 99 |
Assume, just for this example, that each exit fills at its level and cancels the other. The first sequence produces a 1.50-point gain; the second a 1-point loss. The difference comes entirely from information the candle does not contain.
A bar-based engine needs a rule to resolve that uncertainty. NinjaTrader’s Standard historical fill processing, for example, constructs an assumed intrabar path using the open’s proximity to the high and low. That is a documented modelling choice, not a recording of what happened.1
When a strategy frequently enters and exits within one bar, flag trades whose outcome depends on that assumed path. Rerun them with finer historical data where supported. If the necessary history is unavailable, record the ambiguity rather than quietly awarding the favourable result.
The useful question is not whether the candle looks convincing. It is whether the test had enough information to support the trade it recorded.
A candle can contain both your stop and your target. It cannot tell you which one saved the evening.
A Touch Is Not Your Fill
The chart traded at your limit price. Your backtest bought there. That still leaves a missing question: was there enough opposing interest to reach your order?
Consider a simplified first-in, first-out queue at one price. There are 30 contracts ahead of your buy order. Sellers execute 10 contracts at that price, with no cancellations or other priority changes. Trading has occurred at your level, but your order has received nothing.
CME documents FIFO allocation by timestamp, alongside other matching algorithms. The applicable rules depend on the product, so do not turn this example into a universal queue model.2
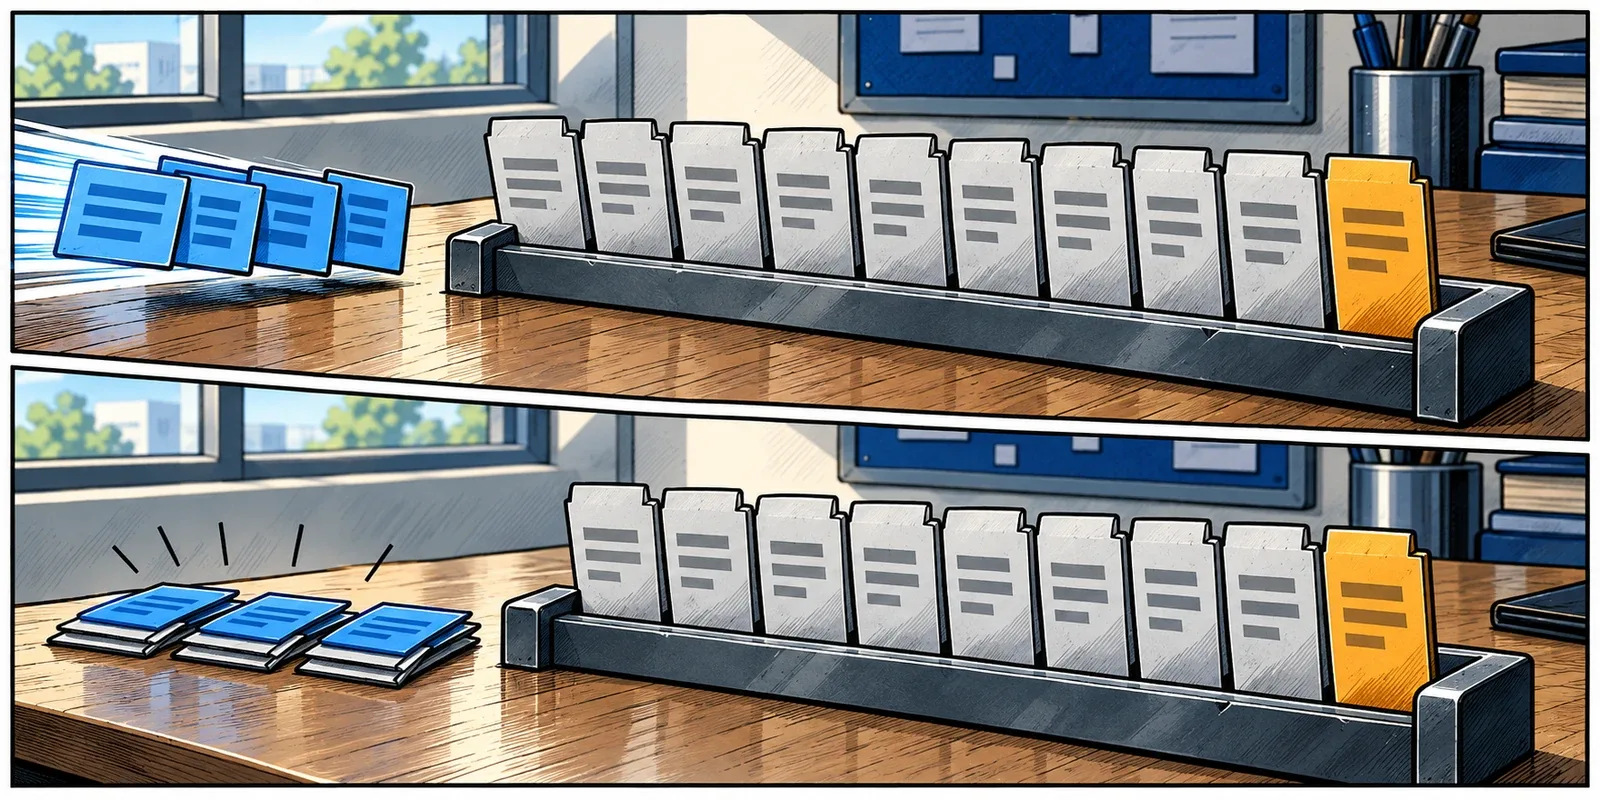
NinjaTrader exposes a setting called Fill limit orders on touch. It controls whether a single touch can satisfy the backtest’s limit-fill rule.3 That is a useful setting to inspect before adjusting the strategy itself.
Start with the trades most likely to flatter the report: entries at session extremes, targets touched once, and large orders filled completely at one price. Ask what data and rules support those fills.
Requiring price to trade through a limit can be a useful sensitivity test, but it is not a substitute for modelling queue position, available size, and arrival time. It may reject fills you could have received as well as remove optimistic ones.
Missed entries also change more than the cost of a trade. They can change which position exists, which orders follow, and whether the next signal is eligible. A fixed slippage deduction cannot reproduce all of that.
The price reaching your order is only half the question. The other half is whether the market reached you in line.
Count the Cost of Getting In and Out
Before adding a slippage number, establish what price your engine already uses. Last trade, bid, ask, and midpoint are different inputs. The SEC’s order guide specifically warns that the last-traded price is not necessarily an available market-order fill.4
For a simple illustration, suppose a stock is quoted at a 100.00 bid and 100.02 ask, with sufficient size and no quote change. Buying at the ask and immediately selling at the bid loses 0.02 per share before fees. A model that buys and sells at the midpoint has removed that cost.
But if your engine already uses executable bid and ask prices, charging the full spread again would count it twice. Write down what each adjustment represents.
A Small Gross Result Does Not Leave Much Room
CME’s Micro E-mini S&P 500 futures contract, MES, is worth $5 per index point. Its 0.25-point tick is therefore worth $1.25 per contract.5
Consider an invented test with 200 completed one-contract trades, averaging four ticks gross per round trip. That produces $1,000 before costs: 200 x 4 x $1.25.
Now assume an illustrative $2.50 in combined commissions and exchange fees per round trip. This is an arithmetic assumption, not a broker quote. Keep the same trades and apply adverse execution adjustments to both entry and exit:
| Cost Assumption | Execution Adjustment | Fees | Net Result |
|---|---|---|---|
| No costs included | $0 | $0 | $1,000 |
| Fees only | $0 | $500 | $500 |
| Fees + one tick worse on each side | $500 | $500 | $0 |
| Fees + two ticks worse on each side | $1,000 | $500 | -$500 |
In the one-tick-per-side scenario, execution adjustments consume 50% of the gross result. Fees consume the remaining 50%.

This is a cost-sensitivity calculation, not a prediction or a fresh strategy simulation. It holds the trade list fixed and treats the execution adjustment as the total additional price penalty relative to the original fills. Do not add an overlapping spread charge. Real missed fills, partial fills, and changed positions require a rerun that models those behaviours.
Use your own fee schedule and relevant execution observations when available. Test several cost scenarios, including demanding sessions, rather than selecting the one that leaves the nicest curve.
Four ticks of gross profit leave four ticks to pay for everything the backtest left out.
Replay, Paper, and Live Are Different Tests
It is tempting to treat a better-looking simulation as a rehearsal that has become reality. Each testing mode still answers a particular question.
NinjaTrader
High order-fill resolution supplies finer historical data for fill processing. It can help investigate intrabar ambiguity, but is not supported with multi-time-frame or multi-instrument strategies, or alongside Tick Replay. Those cases need an appropriate strategy implementation, such as submitting orders to a single-tick series.1
Tick Replay is a different feature. It supports historical tick-event calculations for scripts written to use them. NinjaTrader explicitly cautions against treating it as a way to reproduce live strategy backtest results.6
Check Include commission, the commission template, and the slippage setting. NinjaTrader’s slippage input applies to market, stop-market, and market-if-touched orders, not limit orders.3 Its historical implementation also limits the adjustment to the next bar’s range.1 Know the setting’s behaviour before calling it a stress test.
Playback lets you trade in simulation against recorded market data.7 It helps examine event sequences and order handling. It does not insert your hypothetical orders into the original market or establish the queue priority they would have received.

MetaTrader 5
Distinguish Every tick, which generates ticks, from Every tick based on real ticks, which uses broker-collected tick history. Check the available history and test log rather than assuming the label settles every data question.8
MT5 also offers execution-delay settings. No Delay is an idealised condition; Random Delay is a broad seconds-based model, not a measurement of your broker route. Fixed delay lets you specify a value, but ping alone does not capture platform processing or broker handling.8
There is an important boundary: the tester applies delay to EA trade requests, such as placing or modifying an order. It does not add that same client-network delay when an already-placed pending order triggers on the server.8 The order’s location changes what needs modelling.
IBKR Paper Trading
IBKR states that paper orders do not execute on an exchange. Its simulator uses top-of-book prices rather than deep-book access, and some order behaviour differs from production.9
That makes paper trading useful for testing your application and workflow. It does not establish how a larger order would consume real depth or where a resting order would sit in the live queue.
Use the modes together: historical tests for repeatable comparisons, replay for event-by-event inspection, and paper trading for operating behaviour on an incoming feed. None independently proves future live fills. You do not need to risk capital merely to investigate a software discrepancy.
A more detailed simulation can answer a better question. It is still a simulation.
Walk Through the Orders, Not Just the Curve
An equity curve can hide the exact assumption you need to find. Choose a small, deliberate sample from the trade list and reconstruct what happened.
Include a limit touch, a same-bar stop-and-target case, an order during a fast move, and an ordinary trade. Keep the ordinary one: otherwise you can spend an afternoon explaining exceptional cases without checking the routine.
For each, record:
- Decision: What information existed when the signal became true? A completed bar’s high or close cannot be used before it was known.
- Submission: When would the order have been created and sent? Was the test calculating at bar close while the intended live strategy calculates intrabar?
- Arrival and fill: What executable price, available quantity, and fill rule support the result? Record partial or missing fills, not only completed trades.
- Exit: Was the protective order active yet? What happened to the other exit after a fill, cancellation, or rejection?
- Accounting: Which fees and price adjustments were already included?
NinjaTrader documents differences between historical, simulation, and live fill models. It also highlights a separate trap: some Renko constructions and Heikin-Ashi bars use altered prices. A chart can be useful for generating a signal without every displayed price being available for execution.10

Keep the instrument or contract, session template, time zone, data source, and strategy version with the result. These details make a disagreement reproducible. If a futures test spans a rollover, document how contracts and price adjustments were handled; do not assume a continuous research series is an executable contract.
Label findings plainly: supported by the records, assumed by the model, or unknown. Unknown is a useful result. It tells you what data or test is missing.
A result you can reconstruct is more useful than a curve you can admire.
Give the Test Room to Disagree
Once you find an optimistic assumption, resist the urge to retune the strategy immediately. First hold its parameters fixed and find out how much that assumption contributed.
Here is a compact audit to keep beside the next report:
| Check | Change in the Test | Keep With the Result |
|---|---|---|
| Intrabar sequence | Use finer execution data where supported | Trades whose exit or timing changed |
| Limit fills | Test a less generous documented fill rule | Missed and partial fills, not just net profit |
| Costs | Apply fees and several non-overlapping execution penalties | Net result and cost per completed trade |
| Timing | Vary submission delay where the engine supports it | Orders and signals affected |
| Operating behaviour | Inspect replay and designated paper-account logs | Rejections, cancellations, duplicate orders, position mismatches |
This is an execution audit, not the whole validation process. Keep a separate, untouched period for evaluating the chosen strategy. Once repeated adjustments are guided by that period’s results, it is no longer an independent check.

More detailed tests also need more computing time. NinjaTrader notes that finer historical fill data increases processing work.1 Measure what is limiting your own runs: calculations, memory capacity, or reading history. Avoid letting a research job compete with a live trading workspace for resources.
At ChartVPS, Alpha combines dedicated Ryzen 9 9950X processing resources with Gen4/Gen5 NVMe storage; Delta provides a full physical server for larger research workloads.1112 Those choices address the work of calculating tests and moving historical data. They do not supply missing market history or make an optimistic fill model more truthful.
The point is to have enough capacity to perform the checks you would otherwise skip, then preserve the evidence. When a result changes, you should be able to explain why.
Before trusting the next curve, pick one of its best-looking trades. Follow it from the information available at the time to the order the engine says it filled. That is a productive place to spend the next half-hour.
The most useful backtest is one whose assumptions you can explain, challenge, and reproduce.
Related Reading
- Latency Is Not Execution Speed
- Dedicated CPU vs Shared vCPU: What Your Trading Platform Actually Gets
- Why Your Charts Take So Long to Load
Sources
- NinjaTrader Help Guide, Understanding Historical Fill Processing. ↩ ↩ ↩ ↩
- CME Group Client Systems Wiki, CME Globex Matching Algorithm Steps. ↩
- NinjaTrader Help Guide, Backtest a Strategy. ↩ ↩
- U.S. Securities and Exchange Commission, Understanding Order Types. ↩
- CME Group, Micro E-mini S&P 500 Futures. ↩
- NinjaTrader Help Guide, Tick Replay. ↩
- NinjaTrader Help Guide, Playback Connection. ↩
- MetaQuotes, MetaTrader 5 Strategy Testing. ↩ ↩ ↩
- Interactive Brokers, About Paper Trading Accounts. ↩
- NinjaTrader Help Guide, Discrepancies: Real-Time vs Backtest. ↩
- ChartVPS, Alpha Trading VPS. ↩
- ChartVPS, Delta Dedicated Servers. ↩