
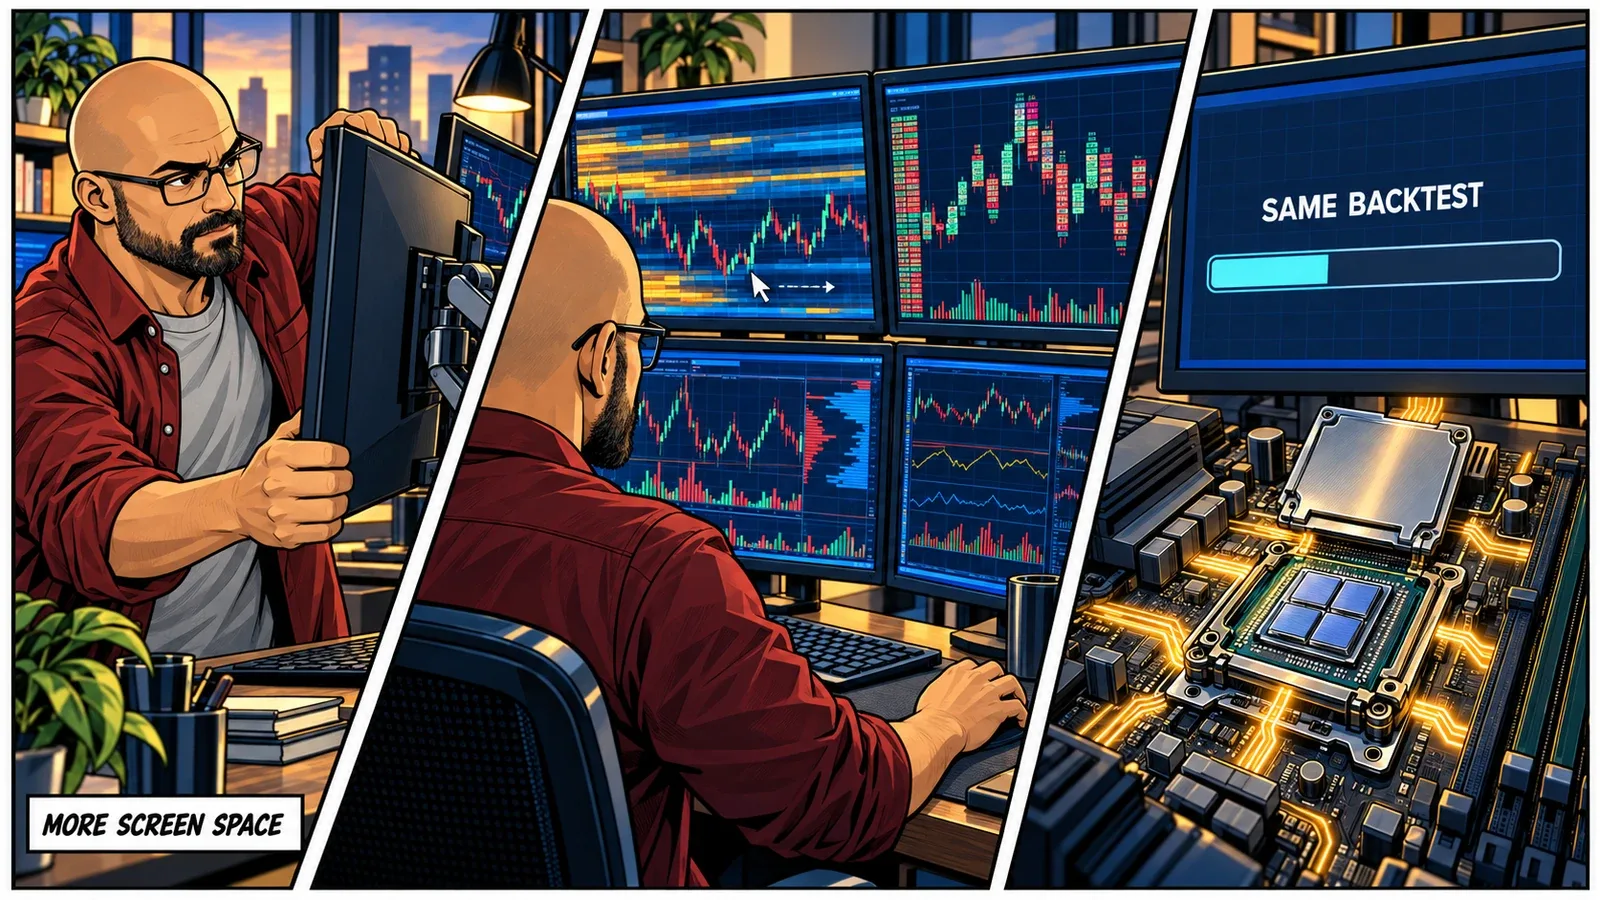
The extra screen seemed reasonable. You wanted the footprint beside the heatmap instead of behind it. Then came a second instrument, a longer view of the session, and a few studies you now miss when they are absent.
None of that feels extravagant when each window has a job. Together, though, they have changed what your computer needs to deliver.
Suppose you add a better GPU. Moving between charts feels smoother. Resizing the heatmap no longer interrupts your train of thought. But the backtest you left running still takes about as long, and one particular indicator remains slow to initialize.
That can be a perfectly consistent result. The graphics improved; the other work did not move to a different processor just because one became available.
The useful question is not simply whether a trading platform uses a GPU. It is which parts use it, how much work they create, and whether those are the parts you are waiting for.
Drawing the Chart Is a Job of Its Own
A footprint contains calculated information and a visual representation of that information. The platform has to organize trades by price and apply its rules. It also has to draw the cells, numbers, shading, labels, and current view. Those are related jobs, but they are not interchangeable.
The CPU, your main processor, runs the application’s instructions and coordinates its work. The GPU, or graphics processing unit, can handle large amounts of drawing work in parallel when the application’s rendering system uses it. The CPU still prepares work and submits drawing commands. The division is a collaboration, not a handover of the whole platform.1
That distinction becomes tangible when you pan through a detailed heatmap or expand a footprint across a larger window. The values may already be available, yet the platform still needs to construct the next view quickly enough to keep the interaction comfortable.
Some apparent graphics problems start elsewhere. An indicator can spend too long calculating before there is anything new to draw. The application can also create drawing objects inefficiently. NinjaTrader’s developer guidance, for example, warns that repeated calculations inside rendering callbacks can cause unnecessary CPU spikes.2
So keep two observations separate: how quickly the information is prepared, and how smoothly you can work with it on screen. A GPU upgrade can improve the second without materially changing the first.
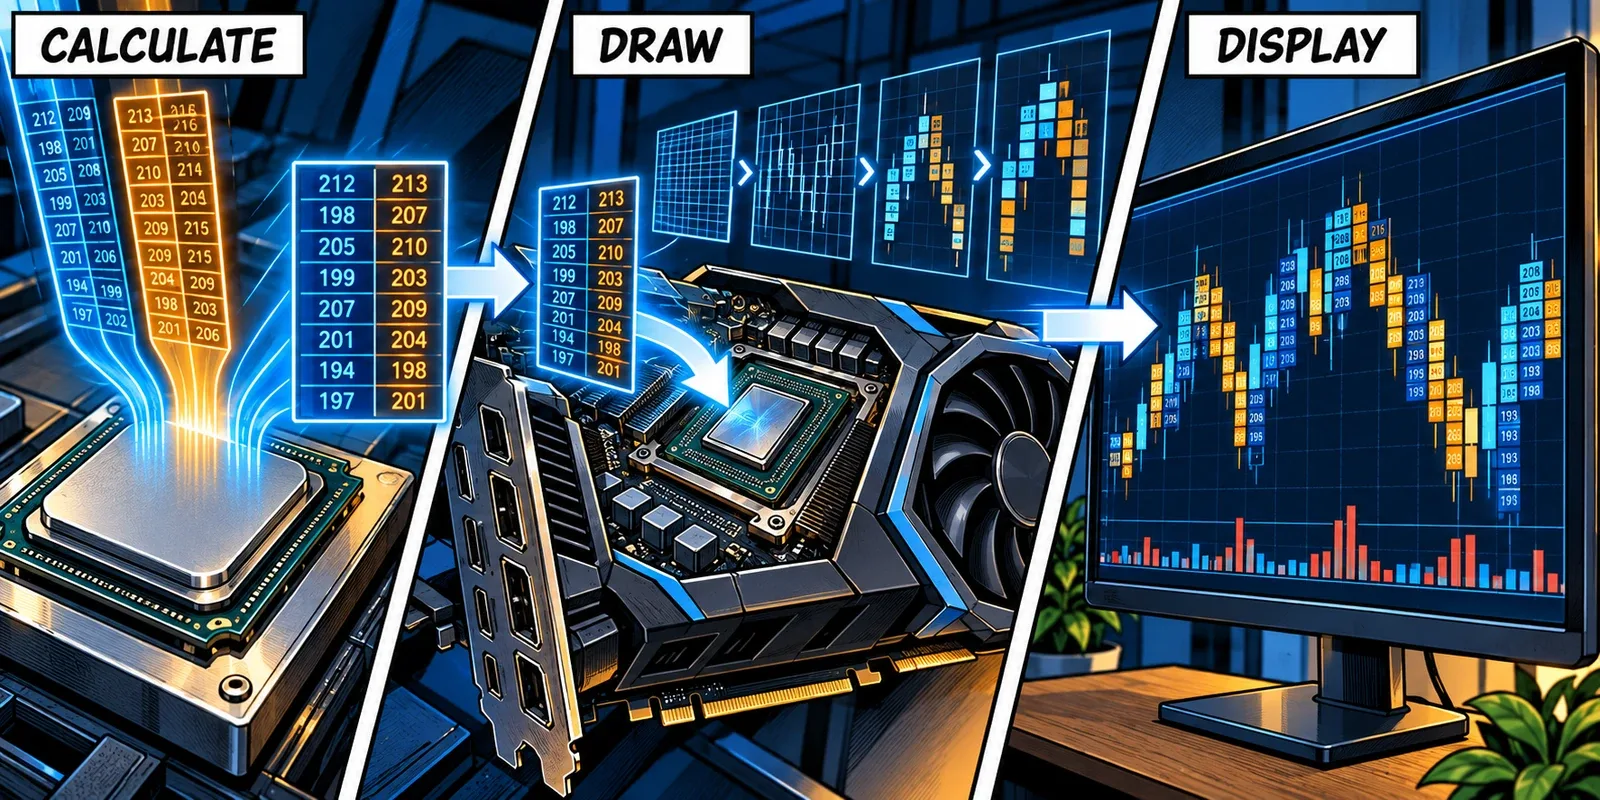
A smoother chart is a useful improvement. It is not evidence that every calculation became faster.
More Screen Space Has a Hardware Cost
Resolution is a useful place to put numbers on the discussion. Count the pixels, rather than the monitors:
| Display Resolution | Pixels per Screen | Relative to 1080p |
|---|---|---|
| 1920 x 1080 | 2.07 million | 1x |
| 2560 x 1440 | 3.69 million | 1.78x |
| 3840 x 2160, or 4K UHD | 8.29 million | 4x |
A 4K screen has 300% more pixels than a 1080p screen. Two 4K screens contain about 16.6 million pixels. These are resolution calculations, not performance measurements. Actual rendering work also depends on what changes, how often it changes, and how the software draws it.
Graphics memory, often called VRAM, holds resources the GPU needs. Those can include image surfaces, textures, cached graphics, and buffers used to build or present frames. A busy desktop has more to keep available than the final image you see.3
On a discrete graphics card, dedicated VRAM is separate from system RAM. Windows can also let a GPU use shared system memory. That is not the same resource as memory on the card, and seeing some shared-memory use does not, by itself, prove something is wrong.4
Look for a repeatable relationship. Does the workspace begin to stutter as dedicated graphics memory fills? Does closing one graphics-heavy view restore responsiveness? Does a lower resolution change the result? Those observations are more useful than assuming that a particular number of gigabytes supports a fixed number of charts.
A chart count leaves too much out. Six relatively simple price charts and six dense order-flow views can ask very different things of the same machine. More VRAM provides capacity; it does not automatically make a lightly loaded GPU quicker.
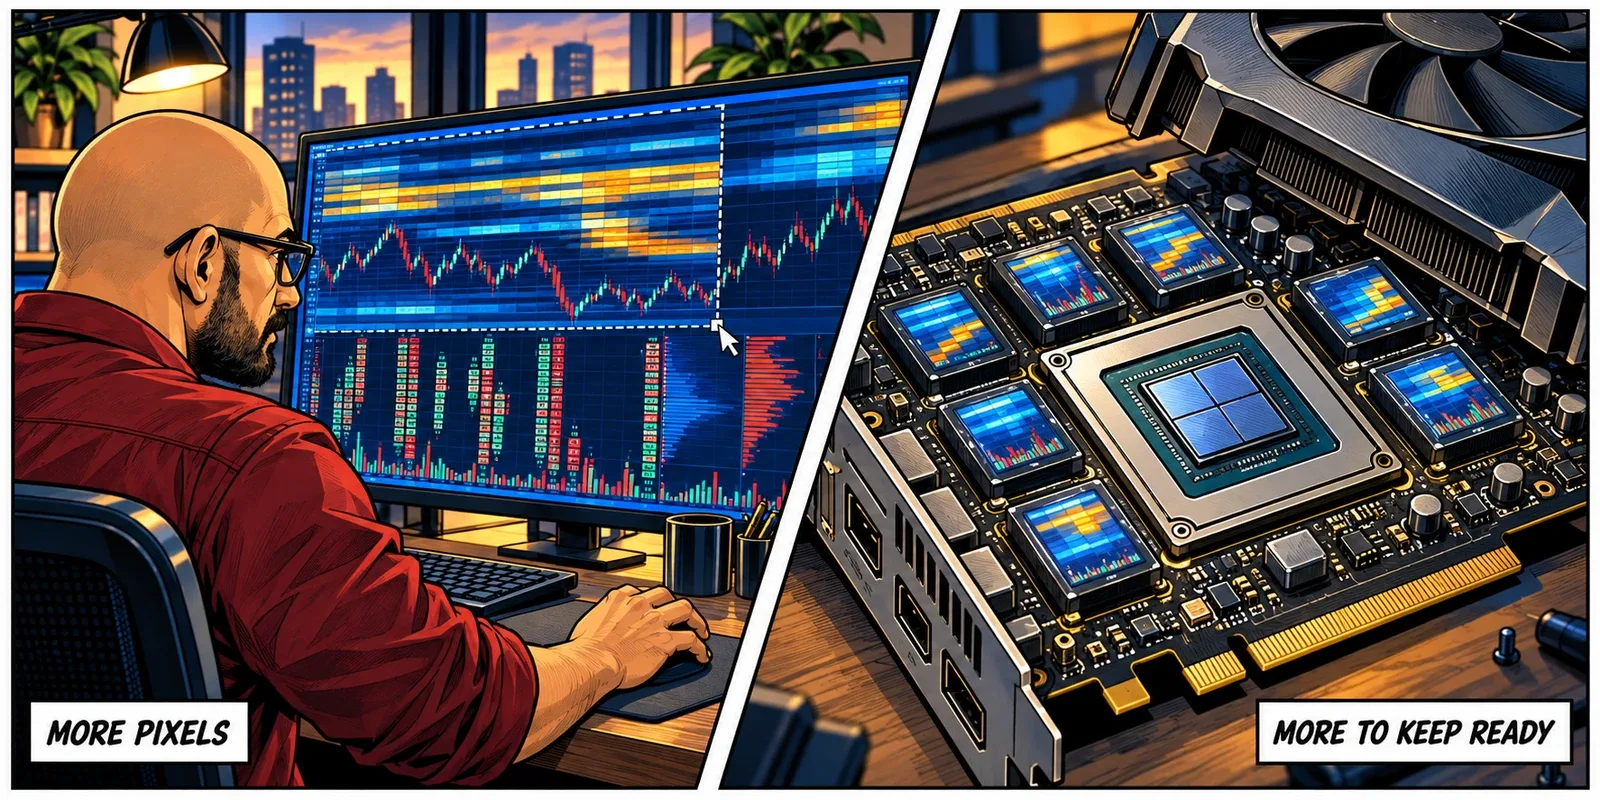
Count what the screens are asking the system to draw, not just how many screens you own.
Three Platforms, Three Useful Distinctions
NinjaTrader, Bookmap, and Sierra Chart all put market information on screen. Their implementation details are worth keeping separate.
NinjaTrader
NinjaTrader’s charts use SharpDX, a software layer exposing Microsoft’s DirectX graphics facilities. Its documentation describes hardware-accelerated drawing of the lines, shapes, and text used in charts.5 That makes graphics capability relevant to a visually demanding NinjaTrader workspace.
It does not turn ordinary NinjaScript calculations into GPU programs. NinjaTrader separates its OnRender() drawing callback from historical strategy logic and explicitly says that rendering should not be used as the basis for backtesting logic.6 Its optimization guide describes using CPU cores for Strategy Analyzer optimizations.7
For an NT user, the practical distinction is straightforward: assess chart interaction and strategy testing separately. A custom indicator may have both an expensive calculation and an expensive drawing routine. Its developer can tell you which one a hardware change would address.
Bookmap
Bookmap’s continuously changing heatmap makes graphics performance particularly visible. Its documentation describes GPU acceleration through OpenGL and a default chart refresh rate of 40 frames per second, or one refresh every 25 milliseconds. It also provides a refresh-rate control for machines struggling with that workload.8
That is a display cadence, not a measure of order latency or an exchange’s update interval. The distinction matters when comparing a smoother heatmap with a faster trading connection.
Adding instruments and visible detail can increase the work around the display too. Keep CPU and system-memory observations alongside graphics measurements. An enabled GPU option does not make the rest of the application cost-free.
Sierra Chart
Sierra Chart offers a Use OpenGL for Chart Graphics option. Its documentation identifies this as hardware-accelerated graphics output and requires a restart for a change to take effect.9
Study recalculation remains a separate consideration. Sierra Chart’s performance guidance discusses both graphics load and the CPU and memory work created by history and studies, including volume-at-price processing.10
For a footprint-heavy Chartbook, test those separately. Does scrolling improve, or does the study itself finish recalculating sooner? If a rendering change causes trouble, follow Sierra Chart’s documented guidance rather than layering more driver tweaks onto an uncertain result.
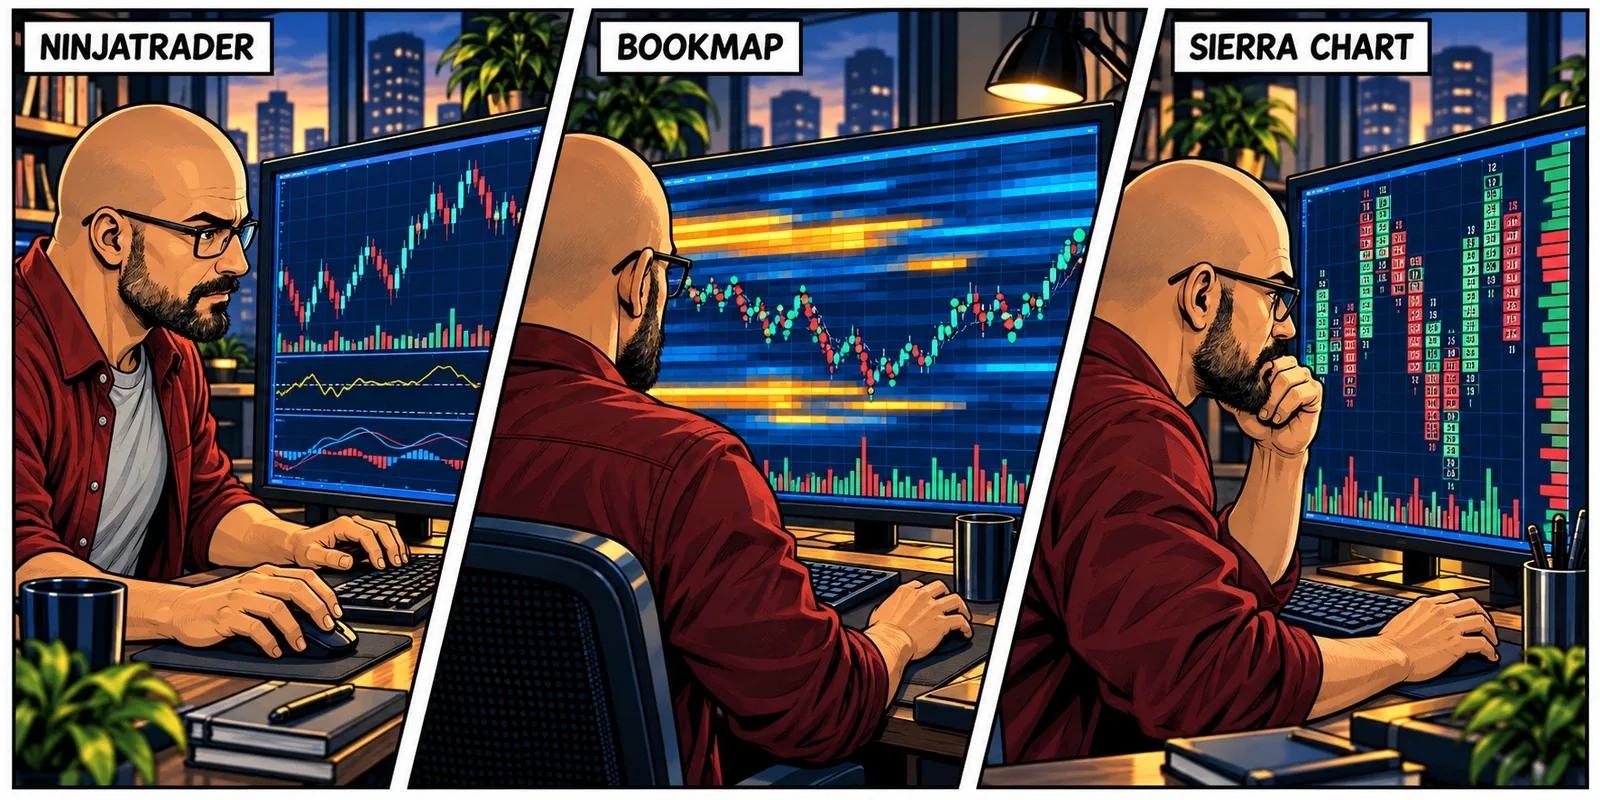
Ask which part of your platform uses the GPU. The platform name alone is not enough.
A Remote Screen Adds Another Stage
On a local workstation, the graphics hardware and your displays are in the same environment. With a VPS, the platform runs elsewhere and you receive a representation of its desktop.
That creates separate jobs: render the application on the server, encode the changing screen for transmission, carry it over the connection, then decode and display it on your device. Microsoft documents both hardware- and software-based encoding in Remote Desktop, with the available path depending on the environment and configuration.11
The GPU in your laptop does not become the GPU inside the VPS. It may participate in displaying the remote session, but server-side chart rendering needs an appropriate graphics setup on the server. Conversely, a capable server GPU does not remove a poor connection or a struggling client device.
Rendering and video encoding are also different GPU jobs. Microsoft’s configuration guidance treats application rendering and remote-frame encoding separately.12 Seeing a GPU listed in the virtual machine is therefore a starting point, not the entire verification.
If a chart is responsive on the host but unpleasant through Remote Desktop, ask support to examine the delivery path. Note your client application, display resolution, monitor count, connection conditions, and the exact interaction that stalls. A screen recording can be useful if it excludes account details and other sensitive information.
The aim is to locate the delay before replacing hardware that is already completing its part of the job.
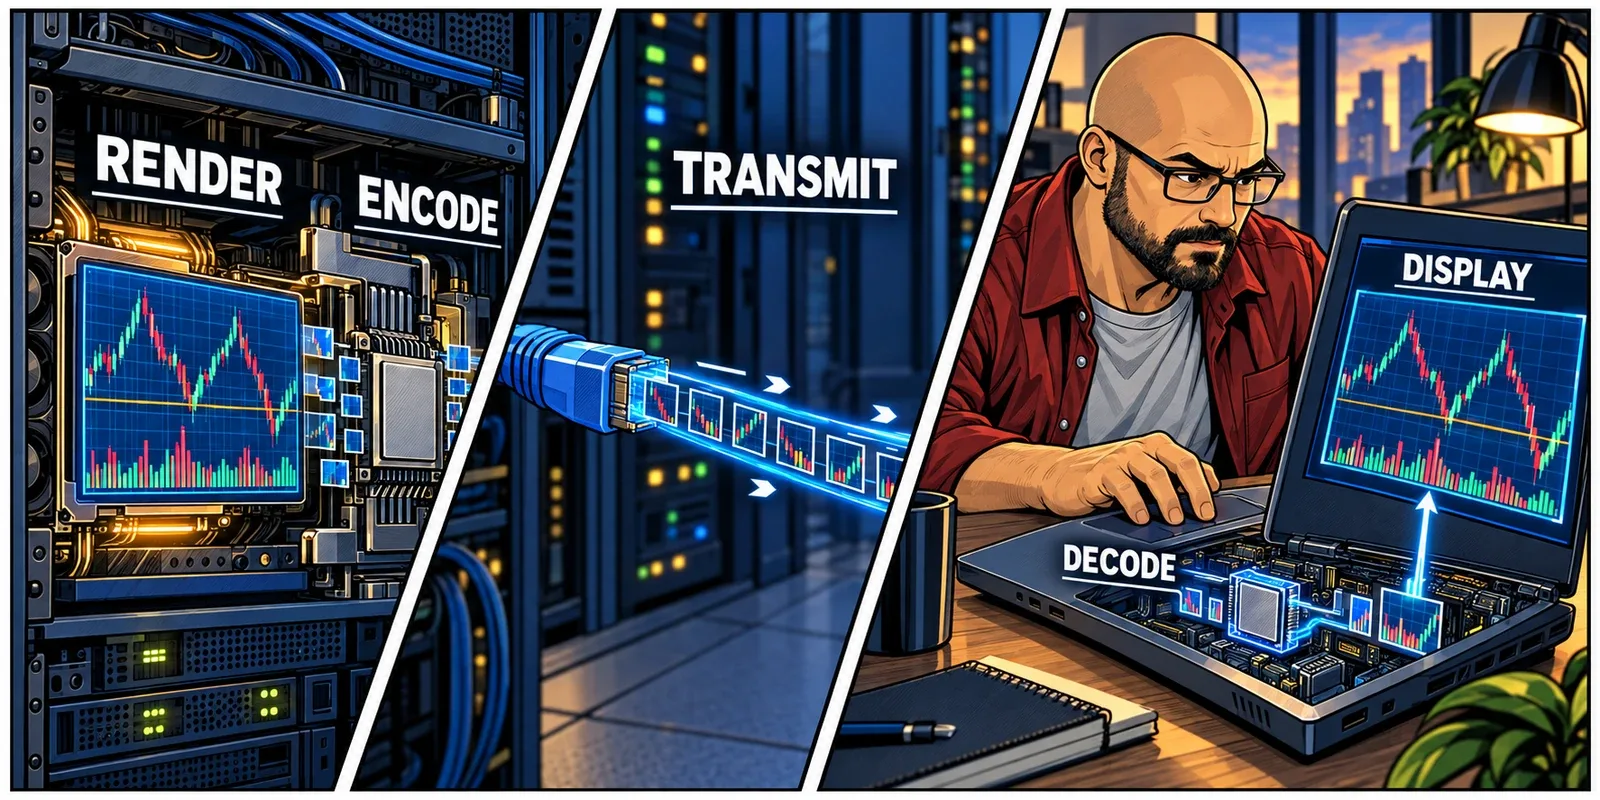
With a VPS, the screen you see is the end of a process that began on another machine.
Research Is a Different Use of the GPU
Graphics and numerical computing can use the same hardware for quite different purposes. Instead of drawing a heatmap, a research program might use the GPU to process many independent calculations together.
Imagine generating 10,000 simulated return paths for a scenario study. Each path contains sequential steps, but many paths can be processed alongside one another. That is a plausible parallel workload, not a claim that a GPU will accelerate every simulation by the same amount.
The software has to express that work in a form the GPU can run. CUDA is NVIDIA’s computing platform for doing this. A Python researcher might use CuPy, which provides GPU arrays and numerical operations with an interface familiar to NumPy users.13 That can support batches of simulations or large array calculations without writing every low-level operation from scratch.
Another concrete example is XGBoost, a machine-learning library that supports GPU training when configured to use a CUDA device.14 A team fitting models to market-derived features can test that route. Installing a card alone does not change where the training runs.
Data movement and setup time count. If a small calculation repeatedly sends data from system memory to the GPU and back, the transfer overhead can consume the advantage. Keeping suitable work on the device for a larger batch can make better use of it.15
Measure the complete research task and check the results, not just the fastest-looking stage. GPU operations can run asynchronously, so a timer that stops before the device finishes can report a misleadingly short duration. CuPy documents GPU-aware timing and warm-up considerations for that reason.16
A GPU-enabled research library and a platform’s ordinary backtest engine are different implementations. Find out which you are using before transferring expectations from one to the other.
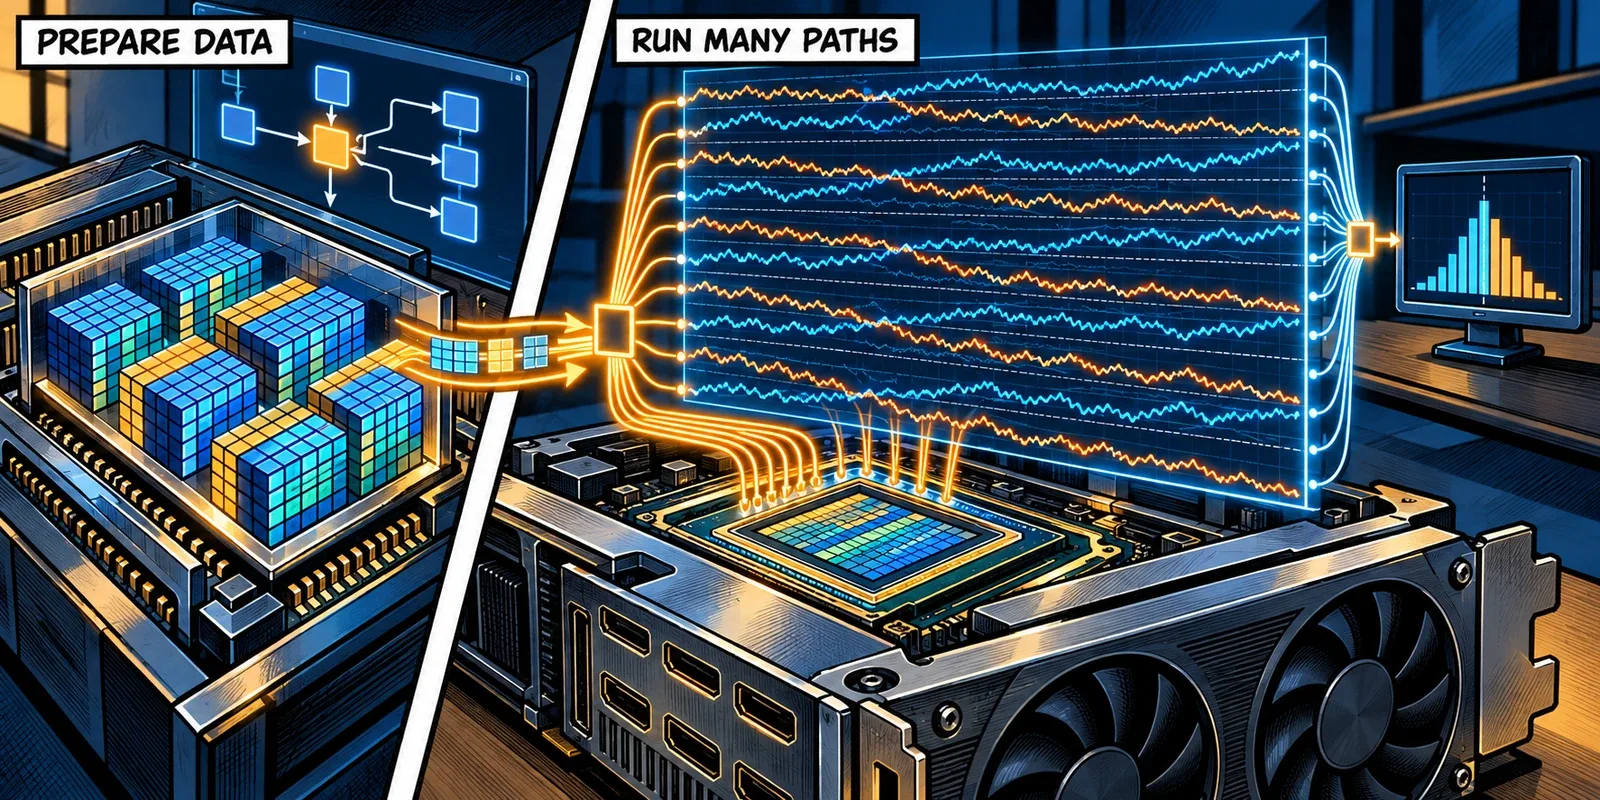
Faster research starts with a workload the software can divide, not simply a card it can detect.
Test the Workspace You Intend to Keep
Return to the expanded trading setup. Before choosing hardware, write down what would count as a useful improvement: smoother heatmap navigation, fewer pauses when changing layouts, support for another display, or a shorter research run.
Use a saved test workspace outside live trading. Keep automated order submission disabled in the test. Record the platform version, indicators, instruments, history range, display resolution, and graphics settings so you can reproduce the same job.
Then separate the observations:
| What You Notice | A Useful Next Check |
|---|---|
| Panning or resizing stalls | Rendering activity, graphics memory, and the complexity of the visible view |
| A study takes a long time to initialize | CPU activity, requested history, and the study’s calculation method |
| Problems begin after adding displays | Total resolution, graphics resources, and the remote-session configuration |
| A research job barely uses the GPU | The library’s device setting and which stages have GPU implementations |
| Only the remote view feels delayed | Encoding, connection quality, and client-side decoding or display |
On supported Windows systems, Task Manager can show GPU engines and dedicated and shared graphics memory. Look at the relevant process and engine, not only the headline percentage. A GPU has separate kinds of work, and one graph does not describe them all.4
Change one variable at a time. Try the same saved view at a lower resolution, or close one visually expensive chart. Compare a repeatable replay segment when the platform supports it, then check the intended live workload separately. A quiet recording is not a substitute for observing a busy session.
You are collecting evidence for a choice, not trying to win a benchmark. A configuration that keeps your required views usable is more valuable than one that produces a large GPU-utilization number.
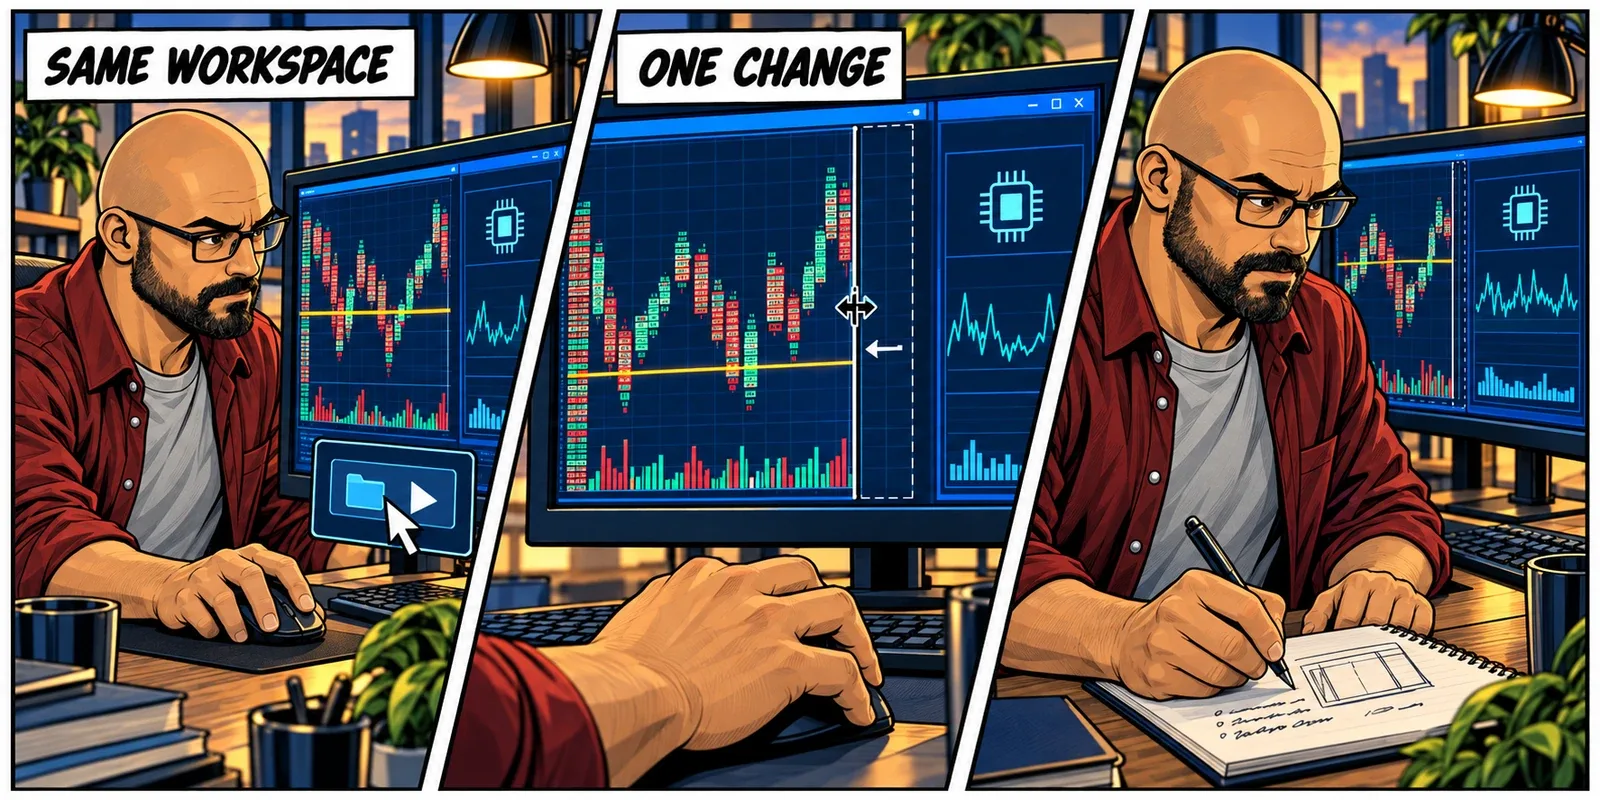
Start with the interruption you want to remove. Let that determine what you measure.
Choose the Combination, Not Just the Card
A modest chart layout may already run comfortably on integrated graphics, the graphics processor built into the CPU. A larger order-flow workspace may justify a discrete GPU and more graphics memory. A research job may call for substantial GPU compute capacity even with only one screen attached.
Those are different reasons to buy hardware. Keep the CPU, system RAM, storage, and software requirements in the decision. The GPU does not replace them.
At ChartVPS, that distinction informs the Gamma configuration: Ryzen 9 9950X CPU resources alongside virtualized NVIDIA L4 graphics, with dedicated GDDR6 graphics memory specified by plan. The combination supports CPU-heavy platform logic alongside graphics-heavy views. Reserved graphics memory is not the same as having the entire physical L4 to yourself. Delta Pro currently pairs the 9950X with a whole NVIDIA RTX 4000 Ada card and 20 GB of graphics memory. These are different allocations for different workloads, not a promise that every platform task moves onto the GPU.1718
For a hosted setup, confirm the graphics-memory allocation, GPU scheduling or compute share, application support, and behavior through your normal remote connection. For numerical research, also confirm that the required compute software and drivers are supported in the chosen environment.
The trader who added a footprint beside the heatmap may have made a sensible GPU upgrade even if the backtest did not finish sooner. The improvement was having the views they needed available and responsive together.
That is a useful outcome on its own. There is no need to turn it into a claim about every other part of trading.
“GPU acceleration” only becomes useful information when you know what is being accelerated.
Related Reading
- Why Single-Thread Performance Still Matters in Trading
- Dedicated CPU vs Shared vCPU: What Your Trading Platform Actually Gets
- Latency Is Not Execution Speed
Sources
- Microsoft Learn, Direct2D and Direct3D Interoperability Overview. ↩
- NinjaTrader Developer Docs, NinjaScript Best Practices. ↩
- Microsoft Learn, Improving the Performance of Direct2D Apps. ↩
- Microsoft DirectX Developer Blog, GPUs in the Task Manager. ↩ ↩
- NinjaTrader Developer Docs, Using SharpDX for Custom Chart Rendering. ↩
- NinjaTrader Developer Docs, OnRender(). ↩
- NinjaTrader Help Guide, Optimization. ↩
- Bookmap Knowledge Base, Supporting Features: Chart Refresh. ↩
- Sierra Chart, Graphics Settings: Use OpenGL for Chart Graphics. ↩
- Sierra Chart, High CPU Usage / Long Time to Load Chart Data. ↩
- Microsoft Learn, Graphics Encoding over the Remote Desktop Protocol. ↩
- Microsoft Learn, Enable GPU Acceleration for Azure Virtual Desktop. ↩
- CuPy Documentation, Basics of CuPy. ↩
- XGBoost Documentation, GPU Support. ↩
- NVIDIA, CUDA C++ Best Practices Guide: What Runs on a CUDA-Enabled Device?. ↩
- CuPy Documentation, Performance Best Practices. ↩
- ChartVPS, Gamma Series. Configuration checked September 27, 2026. ↩
- ChartVPS, Delta Series. Configuration checked September 27, 2026. ↩