
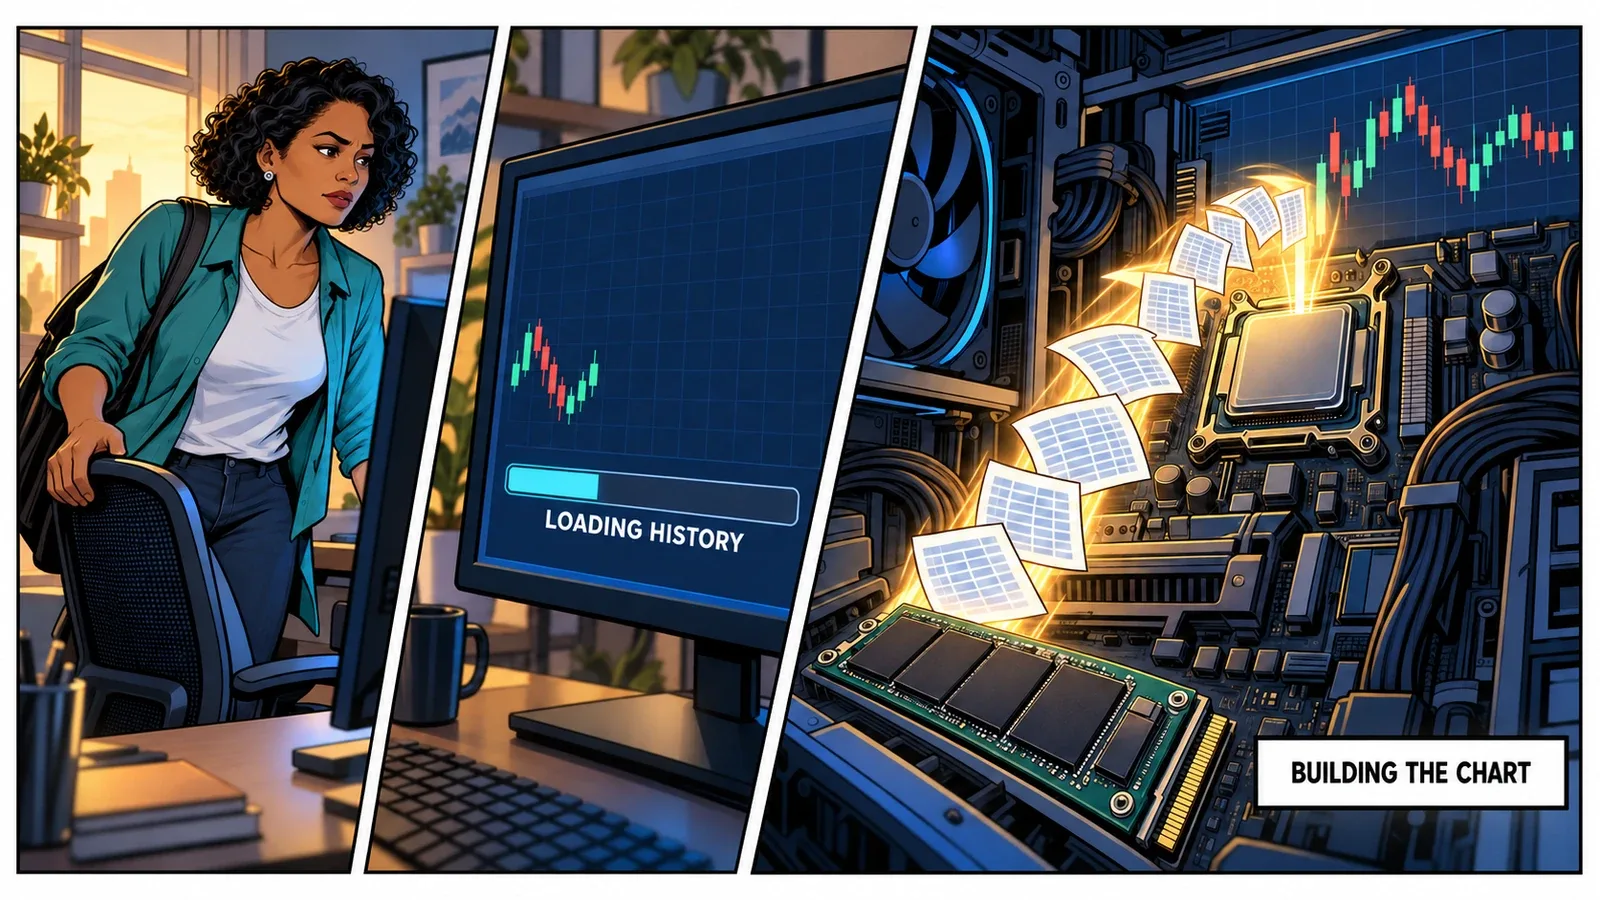
You open your workspace with enough time to get settled before the session. One chart appears. Another is still loading. Your familiar collection of indicators begins arriving in installments.
Yesterday, this took seconds. Today, you have time to reconsider the entire setup.
The obvious suspects are the internet connection and the computer. Both can be involved. But a chart is not a picture that your platform downloads and puts on screen. It is the result of several jobs, and the slowest one can hold up everything you are waiting to see.
That distinction is useful before you buy more hardware, remove an indicator you rely on, or start deleting folders because someone on a forum had a similar problem.
Let’s follow the work, then give you a way to find the delay in your own workspace.
One Loading Message, Several Different Jobs
When you open a chart, your platform needs the right market history, in the right form, with your calculations applied. A useful way to think about the process is:
- Find the data. Check what is already available and request missing history from the data provider.
- Read and prepare it. Retrieve records from local storage and assemble the selected bars and sessions.
- Run the calculations. Build the historical values your indicators and scripts need.
- Draw the workspace. Render candles, studies, labels, and the rest of the interface.
This is a diagnostic model, not a claim that every platform completes four neatly separated stages. Some work overlaps. The point is that a delay in one stage can look much like a delay in another.
NinjaTrader, for example, documents separate sources for chart history, including its local data repository, cache, and connected provider.1 Its drawing system is another layer again: custom charts and indicators can use SharpDX, a graphics library, to render their output.2
For a trader, the distinction is between having the data and being ready to use it. A populated chart may still be calculating a study. A completed study may sit behind a sluggish interface.
Watch what happens before the wait ends. Do candles arrive first and indicators follow? Does the application say it is downloading? Is everything present, but scrolling and resizing feel heavy? Those observations give the next test a direction.

Before asking how to make a chart load faster, ask what the platform is still doing.
Why the Second Load Can Feel Effortless
You open a workspace, wait, close it, then reopen it. Much faster. It is tempting to credit the last setting you changed.
You may simply have given the platform less work the second time.
NinjaTrader can reuse cached data instead of requesting it again from the provider.1 Windows also keeps recently accessed file data in memory through its file cache.3 That means two apparently identical openings can take different routes to the same result.
It helps to separate three situations:
- New history: The required records are not available locally and must be obtained.
- Stored history: The records are on disk, but the platform still needs to read and process them.
- Recently used history: Some of the required data is already available in memory or another reusable cache.
These are working descriptions, not three switches you will find in every platform.
As stored records move from disk into memory, the storage system gets its turn. Its speed becomes more relevant as local history grows or several charts load together.
Opening a new futures contract with months of tick history is a different test from reopening yesterday’s chart. Changing a session template or bar configuration can also change the work required, even when the symbol stays the same.
This is why casual before-and-after tests can flatter an upgrade. The first run pays for the download; the second benefits from data that is already there. A stopwatch records the difference faithfully. It cannot explain it for you.
Keep the first-load result and repeat-load result separate. Record the instrument, date range, bar type, session settings, and whether a download occurred. Do not clear caches just to make a test look rigorous. Removing useful stored data can create the very delay you are trying to understand.

A faster second attempt does not prove the machine got faster. It may have less to do.
Where Fast NVMe Storage Earns Its Place
When the wait is in local storage, a good SSD can make a real difference. Historical datasets have to be read. Platform files have to be opened. Saved research has to be brought back into use.
NVMe and Gen4/Gen5 describe two different parts of the storage system. NVMe is the protocol, the way software sends read and write requests to an SSD. Built for flash storage, it supports multiple request queues and reduces the processing overhead of older storage interfaces. That becomes useful when chart history, platform databases, and research jobs need storage at the same time.4
Gen4 and Gen5 refer to the PCI Express connection carrying that data. Each generation doubles the available bandwidth. For the four-lane connection commonly used by NVMe SSDs, the approximate limits are:5
| Connection | Bandwidth in One Direction | Increase Over Gen3 |
|---|---|---|
| PCIe Gen3 x4 | 4 GB/s | Baseline |
| PCIe Gen4 x4 | 8 GB/s | 100% |
| PCIe Gen5 x4 | 16 GB/s | 300% |
These are rounded connection limits, before protocol overhead, not measured drive speeds or a bandwidth allocation to an individual VPS. Gen5 provides 100% more bandwidth than Gen4, but that does not mean every workspace opens twice as fast.
The distinction is useful in trading. Reading months of tick history benefits from throughput, how much data moves per second. Opening many smaller platform files depends more on access latency, how quickly individual requests finish. Several platform instances add concurrent requests. A storage system needs to handle that mixture, not merely produce an impressive result when reading one large file.6
For your workspace, the useful question is: How much of the wait is actually spent waiting on storage?
Here is an illustration, not a benchmark. Suppose a load takes 20 seconds and four of those seconds are storage work that nothing else overlaps. Halving that portion brings the total to 18 seconds: 50% less time on storage, but a 10% reduction in overall loading time. If storage accounts for most of the wait, the improvement can be much more noticeable.
At ChartVPS, we use Gen4/Gen5 NVMe because those mixed workloads are routine. We insist on these technologies for their efficient request handling and bandwidth: reducing storage-bound delays when loading workspaces, feeding historical data into research, and accommodating platform writes while other tasks read from disk. A fast processor is considerably more useful when it isn’t waiting for its next batch of data.
Ask for workspace measurements, not an SSD speed test presented as a trading result. That is a better buying question for a home workstation and for a VPS.

Buy faster storage for the work storage is doing, not for every wait that happens near it.
Your Indicators Have History to Work Through
The candles may appear before the chart is ready because an indicator needs to establish what happened before the latest bar. Loading your trading view also means loading its context.
Sierra Chart explicitly identifies the amount of history and study recalculation as contributors to long chart loads. Its documentation also explains why volume-at-price studies can add processing and memory demands.7 A plain price chart and a detailed footprint workspace are not equivalent jobs, even when they cover the same trading day.
NinjaTrader adds an important distinction. In ordinary historical processing, OnBarUpdate(), the script method that handles bar calculations, runs at the historical bar’s close. Selecting OnEachTick does not, by itself, reconstruct every historical tick.8
Tick Replay changes that workload. It rebuilds historical bars from individual ticks and can trigger thousands of events within a bar. NinjaTrader warns that this can substantially increase loading time.9
That extra detail can be necessary for a particular study. Keep it when the tool requires it. The useful question is whether every chart needs that treatment and how much history each one genuinely needs.
There is also a CPU trap here. One thread working hard can be hidden inside a fairly quiet overall CPU percentage. A thread is one sequence of software work; a core is a physical processing resource that can execute it. More cores do not automatically split one calculation into smaller, simultaneous jobs.
NinjaTrader uses multiple kinds of threads, including interface threads and background workers.10 Looking at overall utilization alone can therefore miss the part holding up your workspace.
If one particular indicator causes a repeatable increase in loading time, take that result to its developer. It may reflect essential calculations, an overly broad history request, or work that could be implemented more efficiently. You do not have to decide which before reporting a useful test.

The visible chart may be small. The calculation behind it may not be.
Read the Wait, Not Just the CPU Number
Open Windows Task Manager or Resource Monitor while reproducing the delay. You are looking for activity that lines up with the wait, not a single percentage that declares a winner.
Microsoft’s performance guidance separates processor, memory, disk, and network measurements and recommends examining the processes behind resource use.11 For chart loading, that gives you a practical starting point:
| What You Observe | What to Investigate Next |
|---|---|
| The platform reports a historical download | The requested history, provider messages, and whether the next opening reuses it |
| One logical processor stays busy during the wait | Indicator calculations, script behavior, and bar-building work |
| Disk response times rise during platform reads | Local data access and other processes using the same storage |
| Memory pressure and disk-backed memory reads coincide with stalls | Whether the working set has outgrown available RAM |
| Data and studies are present, but navigation is sluggish | Rendering load, drawing objects, and the remote-display connection |
These are clues to investigate, not diagnoses. A busy disk could belong to another process. A quiet CPU could be waiting for a reply, storage, or an application lock.
Memory deserves particular care. Windows calls a read needed to retrieve a memory page from disk a hard fault.12 The name sounds alarming, but it does not mean the RAM is defective. Such reads can occur during normal loading. Persistent memory pressure accompanied by repeated stalls is more informative than the counter alone.
Adding RAM can reduce pressure when the active workload does not fit comfortably. It will not repair a slow historical-data service. Similarly, a remote screen that is slow to redraw does not prove the server is slow to calculate.
Note the time of the incident and what the platform was doing. “NQ tick chart, this date range, this indicator, repeated three times” gives support considerably more to work with than “the VPS feels slow.”
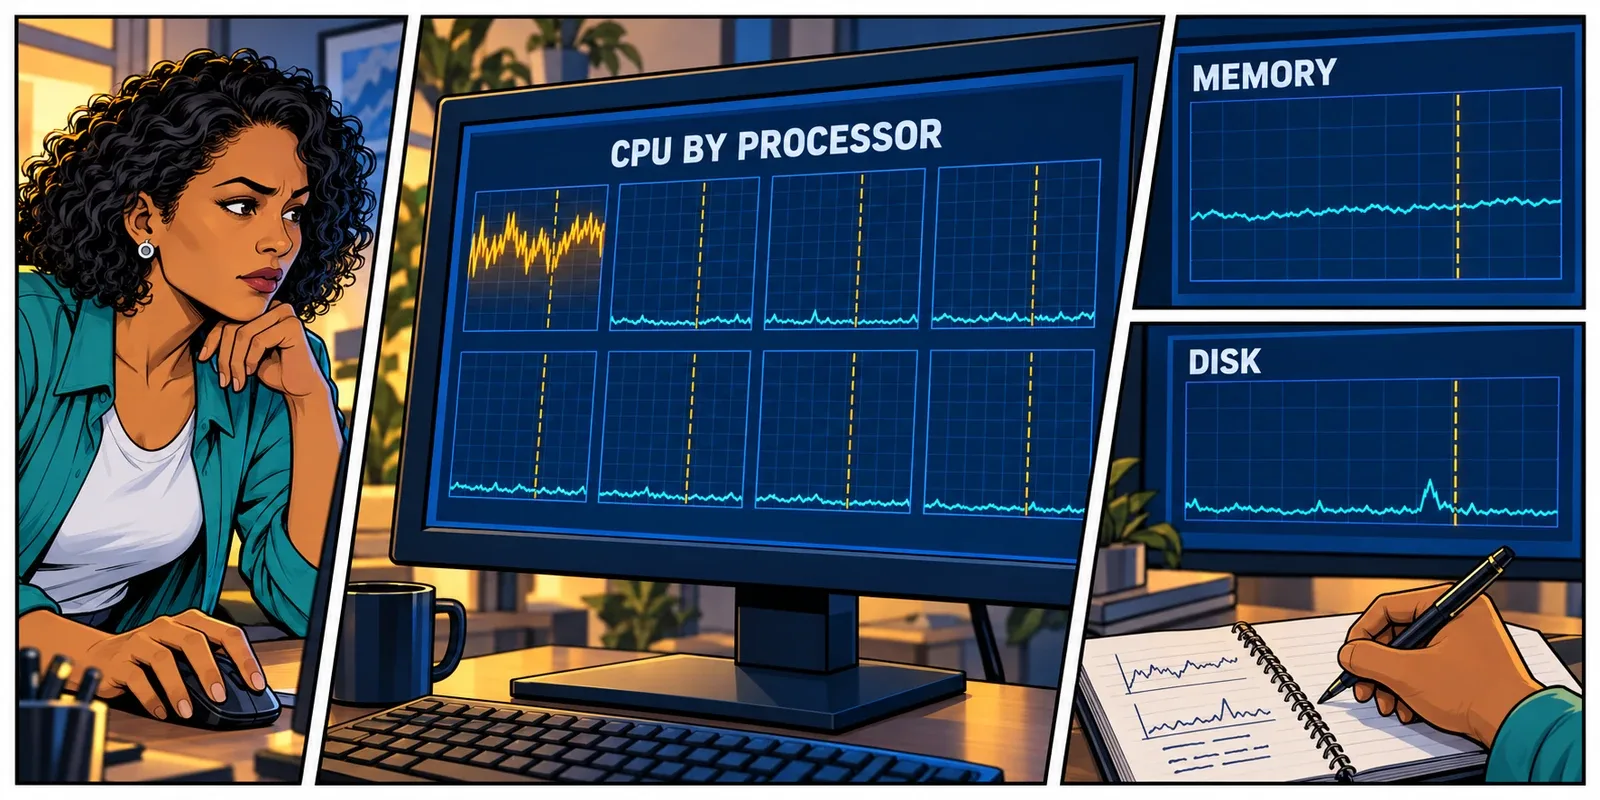
The useful metric is the one that explains the wait you are experiencing.
A Workspace Test You Can Repeat
Set aside a little time outside your trading session. Save a separate copy of the workspace and ensure the test cannot submit live orders. Do not remove studies or alter a strategy that is managing an open position.
Start with one instrument and a fixed historical date range. Keep the connection, trading-hours template, and bar type unchanged. Define “finished” before timing: for example, candles present, required indicators populated, and the chart responding to normal scrolling.
Establish a Plain-Chart Baseline
Open the chart without third-party studies or strategy automation. Record the load time and any download message. Repeat the opening, keeping that result separate from the first run.
If the plain chart is already slow, you have a useful baseline to investigate before adding complexity. If it is quick, you know the machine can complete this smaller job promptly. Neither result settles the whole question.
Add Back the Work You Actually Use
Restore studies one at a time or in small, named groups. Record which change produces a consistent increase. Then test your full workspace, since several individually modest charts can create a substantial combined workload.
Keep a small record:
- Instrument, contract, bar type, and historical date range.
- Indicator names, versions, and relevant settings.
- Tick Replay state and whether the chart downloaded history.
- Time until ready, plus any notable CPU, memory, or disk activity.
Three repeated observations are more useful than one memorable delay. Treat them as troubleshooting evidence, not a statistically rigorous hardware benchmark.
Change One Thing and Keep the Result
Try a smaller history range in the test copy, or remove the study you suspect. Check that the remaining history is still sufficient for the calculations to initialize correctly. A chart that opens quickly with incomplete indicator context is not a successful optimization.
Keep the original configuration available. Do not disable security software, turn off the Windows page file, or erase historical data as a first experiment. If the platform reports a data error, follow its documented repair procedure with support rather than treating every slow load as corruption.

Change one thing. Keep enough of a record to know whether it helped.
Make the Next Open Less Eventful
There is no prize for loading a year of tick history into every chart if today’s work does not use it. There is also no benefit in stripping a workspace so far that it stops supporting your decisions.
Keep the charts and calculations you need. Give research-heavy layouts their own workspace when practical. Before the session, allow required history to finish loading and confirm that the studies you depend on are ready. Schedule experiments for a time when an unexpected restart is merely inconvenient.
When hardware is the constraint, match the upgrade to the evidence: CPU performance for calculations, sufficient RAM for the active workload, NVMe storage with the throughput and access times your local reads need, and suitable graphics capacity for rendering. More of the wrong resource can leave the original problem intact.
For a hosted platform, ask the provider to review the actual workspace and the recorded delay alongside CPU, memory, and storage activity. The diagnosis comes first, whoever supplies the server.
A shorter loading time gives you more of the session to prepare, review, and make decisions. It is not a measurement of order-execution speed. That is another path, with another set of participants.
The goal here is simpler: open the workspace, understand what it is doing, and get back to the market without starting the morning with an infrastructure mystery.
A good upgrade removes a delay you have identified. A good test tells you which one.
Related Reading
- Why Single-Thread Performance Still Matters in Trading
- Dedicated CPU vs Shared vCPU: What Your Trading Platform Actually Gets
- Latency Is Not Execution Speed
Sources
- NinjaTrader Help Guide, Loading Historical Data. ↩ ↩
- NinjaTrader Developer Docs, Using SharpDX for Custom Chart Rendering. ↩
- Microsoft Learn, File Caching. ↩
- NVM Express, NVMe Specification FAQ. ↩
- PCI-SIG, PCI Express 5.0 Specification and Status. The table rounds the one-direction bandwidth of four-lane links; the percentages compare equivalent link widths, not application performance. ↩
- Microsoft Learn, Azure Premium Storage: Design for High Performance. ↩
- Sierra Chart, High CPU Usage / Long Time to Load Chart Data. ↩
- NinjaTrader Developer Docs, Calculate. ↩
- NinjaTrader Developer Docs, Developing for Tick Replay. ↩
- NinjaTrader Developer Docs, Multi-Threading Consideration for NinjaScript. ↩
- Microsoft Learn, Troubleshoot Performance Problems in Windows. ↩
- Microsoft Learn, Hard Faults. ↩