

Imagine comparing two VPS plans that advertise eight vCPUs. Both load Windows. Both open NinjaTrader. Both look perfectly capable during a quiet test.
Then the market opens.
One workspace keeps moving through incoming ticks, indicators, and strategy calculations. The other begins to hesitate. Charts update unevenly. Later, the same optimization takes noticeably longer than yesterday. Task Manager offers little explanation, which is not much comfort when you are trying to trade.
The advertised core count has not changed. The amount of processor time available behind it may have.
This is the part of VPS performance that a simple 8 vCPU label leaves out. Your VPS is a virtual machine: a separate operating environment running on a physical host. The hypervisor is the software layer that allocates the host’s hardware to those virtual machines. It decides when their virtual CPUs get to run.
The count tells Windows how many processors it can schedule work across. It does not tell you their speed, whether other customers compete for the same capacity, or whether full performance lasts through an afternoon of research.
Shared CPU is not automatically bad. Dedicated CPU is not a cure for inefficient code. The useful distinction is narrower: when your trading platform has work ready, how reliably can it get processor time?
A vCPU Is A Place In Line
Three terms need separating before the hosting labels become useful.
- A physical core is processing hardware inside the host CPU.
- A logical processor is a hardware execution context. With simultaneous multithreading (SMT), one physical core can expose more than one; they share that core’s resources.
- A virtual CPU, or vCPU, is the processor that a virtual machine sees and sends work to.
An application thread is a sequence of software instructions. A core runs those instructions; a vCPU is the virtual processor your operating system uses to get them onto the hardware. Two SMT threads are not two full physical cores, and eight vCPUs are not necessarily eight physical cores reserved for you.1
Microsoft documents how Hyper-V maps guest virtual processors onto the host’s logical processors.1 Red Hat describes how a host can have more guest vCPUs allocated than physical capacity available to run them all at once. That is CPU overcommitment.2

Suppose a host has 32 logical processors and runs ten virtual machines with eight vCPUs each. The guests collectively see 80 vCPUs. The host still has 32 logical processors underneath, with some capacity also needed to operate the host itself. This can work well when most machines are idle or lightly used. The hypervisor assigns processor time to whichever guests have work ready.
The arrangement becomes more interesting when several guests want the same physical capacity at once.
That is why 8 vCPU is an incomplete specification. It tells you how much work Windows can try to run at once, not how much host CPU time the plan guarantees.
Two Schedulers Sit Below The Platform
A trading application inside a VPS does not talk directly to a physical CPU core.
First, Windows schedules the threads from your trading platforms, indicators, and background services across the vCPUs visible inside the VM. Then the hypervisor schedules those vCPUs across the host’s logical processors.
There are two scheduling layers between ready software work and the silicon that executes it.

This matters because Task Manager sees your Windows environment, not the whole physical host. Its CPU percentage is not a direct measurement of how long your vCPUs waited to be scheduled. Host-side monitoring is needed to distinguish a busy VM from a busy host.3
Hypervisors use different policies. Microsoft documents controls for caps, reservations, priorities, and isolation.4 In plain terms: a provider can limit how much CPU a VM uses, reserve capacity for it, or give it exclusive access to particular processors.
The plan name does not reveal which policy is in use. “Cloud CPU,” “high-frequency vCPU,” and “premium compute” remain marketing categories until the provider explains the processor and allocation.
For a trader, the practical question is simple: are you buying a defined amount of processing capacity, or access to whatever capacity is free?
Shared CPU Has A Real Use Case
Shared CPU exists because it is efficient.
Websites wait for visitors. Development machines sit idle between builds. Small business applications spend much of the day doing very little. Even trading workspaces have quiet periods. Sharing unused host capacity can lower prices without affecting a light workload in any noticeable way.
Cloud providers openly build products around this pattern. Google’s E2 shared-core VMs time-share processor capacity. Its e2-micro exposes two vCPUs while sustaining a combined allocation equivalent to 25% of one core’s CPU time. The two visible processors are not a promise of two full cores.5 AWS offers burstable instances with a baseline CPU allocation and credits for use above it.6

That makes shared CPU a reasonable fit for testing, occasional research, lightly used terminals, and workloads where variable completion time is acceptable.
The trade-off is predictability. A provider can fit more virtual capacity onto the host because not every customer normally uses every vCPU at once. Red Hat advises against CPU or memory overcommitment in production without extensive testing because the workable ratio depends on the workload.2
Trading creates an awkward demand pattern for aggressive sharing. Many customers become busy around the same events: the cash open, a major economic release, a volatile move, an exchange reconnect, or a data-provider recovery. The peaks are correlated. That is exactly when spare capacity is least likely to be spare.
Fair-share scheduling is fair to the host population. It has no idea that your platform considers the next few seconds unusually important.
Contention Arrives At The Wrong Time
CPU contention is easiest to miss when a platform workload is bursty.
Think of the U.S. cash open. At 09:29 ET, the workspace may be calm. At 09:30, market data accelerates, DOMs refresh, indicators recalculate, and strategies evaluate new conditions. A reconnect or workspace load can add historical requests and bar construction at the same time.
NinjaTrader notes that calculating indicators or systems on every incoming tick can be CPU intensive.7 Tick Replay can generate thousands of events per bar and may take substantial time to load.8 The platform is behaving as configured. It simply needs real processor time to complete the work.

Contention can show up as:
- chart updates arriving in clumps rather than smoothly;
- indicators or NinjaScripts falling behind their expected cadence;
- historical data and Tick Replay loading at inconsistent speeds;
- Strategy Analyzer runs taking materially different times with the same inputs;
- Remote Desktop remaining usable while one CPU-bound platform path struggles;
- low network latency alongside slow platform response.
None of these proves host contention on its own. A saturated application thread, slow storage, memory pressure, inefficient code, antivirus scanning, and a data-provider issue can create similar symptoms.
The pattern that deserves attention is variability without a workload change. If the same local backtest finishes quickly on one run and drags on the next, investigate what changed around it. Host scheduling is one candidate. Thermal limits, background processes, and storage caching are others. Confirm that the test really used identical data and settings before blaming the host.
One quick run cannot separate them. Repetition can.
Steal Time Names The Missing Delay
Linux gives this scheduler problem a useful name: steal time.
The Linux kernel’s /proc/stat documentation records steal as involuntary wait.9 In this context, it is time a virtual CPU loses because the host has not scheduled it to run. Another guest can cause that wait, but so can host-side work. It is a clue about processor availability, not proof that a particular customer caused the problem.

Steal time is not ordinary application CPU usage. It is the gap created below the guest scheduler. A process can be ready inside the VM while the vCPU waits for a turn on the host.
Windows trading VPS users do not get a neat steal field in Task Manager. On Hyper-V, administrators can compare host logical-processor and VM virtual-processor run-time counters to investigate CPU pressure.3 The provider has a view that the customer usually does not.
That leaves two practical routes:
- Ask the provider to inspect host-level scheduling when the slowdown occurs.
- Record repeatable workloads and their completion times so support has specific slow periods to investigate.
This is also why a low overall CPU percentage does not automatically clear the compute layer. Averaging across many vCPUs can hide one busy application thread, and a guest-side reading cannot rule out host scheduling delays. The first article in this series covers the per-thread problem. This one covers the host beneath it.
Different bottlenecks can produce the same complaint. The job is to separate them before buying more of the wrong resource.
A Short Burst Can Mislead
Bursting lets a low-baseline virtual machine use more CPU for a limited period. It is useful technology when the workload matches it.
It also makes a short benchmark a poor test of sustained performance.
In AWS Standard mode, a burstable instance spends accrued CPU credits above its baseline. When the credits run out, it falls back toward that baseline. Unlimited mode can sustain higher use, with extra charges when average usage exceeds the included allowance.6 Google documents full-CPU bursts of 30, 60, or 120 seconds for its E2 shared-core sizes before their normal time-sharing limits resume.5

This distinction maps directly to trading workloads.
A platform launch may be brief. A historical backfill may last several minutes. Tick Replay can run much longer. An optimization sweep can occupy the processor for hours. A machine that looks excellent during startup can settle into very different performance after the temporary headroom is gone.
Not every shared VPS uses credits, and not every variable result comes from bursting. The lesson is broader: test for the duration you actually use.
Run the same operation several times without a long idle period between attempts. Record each completion time. If the first run is consistently fastest and later runs settle at a slower pace, investigate burst policy, temperature, storage caching, and background activity.
Peak speed sells the first screenshot. Sustained speed finishes the work.
Core Count Without Allocation Is Incomplete
The same advertised number can sit on top of very different compute arrangements.
| Advertised Compute | What May Sit Behind It | What The Trader Still Needs To Know |
|---|---|---|
| Shared vCPU | Guest vCPUs scheduled across host capacity used by multiple VMs | Host CPU, overcommit policy, caps, contention and sustained behavior |
| Burstable vCPU | Baseline allocation with temporary access above it | Baseline, credit policy, burst duration and overage behavior |
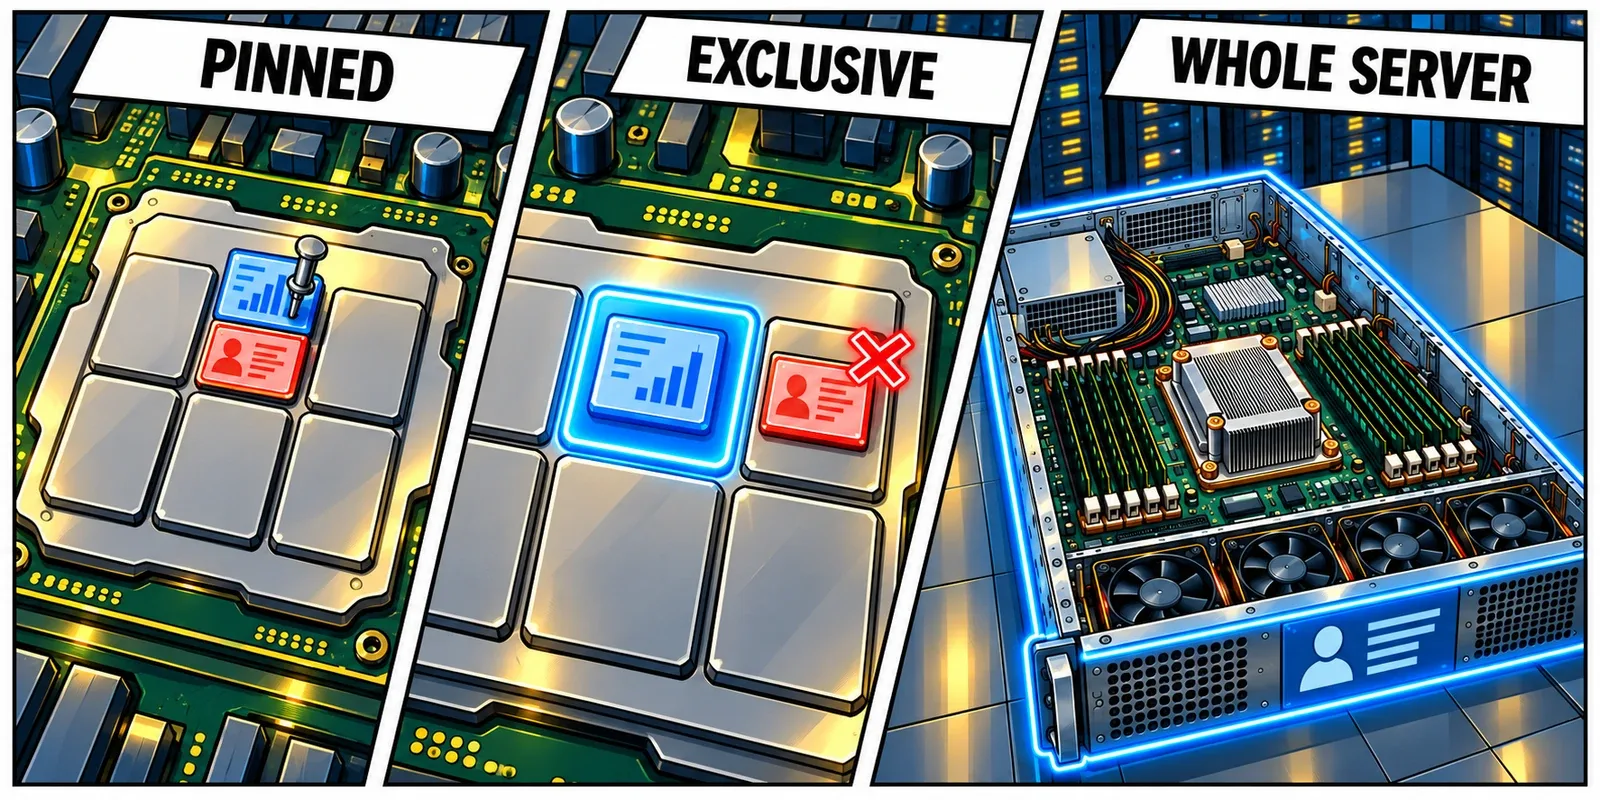
| Reserved or dedicated vCPU | A CPU-time reservation or exclusive processor allocation, depending on the provider | Whether a full physical core or logical processor is exclusive, what is guaranteed, and which CPU provides it |
| Dedicated physical server | The entire host CPU belongs to one customer | CPU model, cooling, SMT configuration and workload fit |
“Dedicated CPU” still deserves a definition. Some providers mean exclusive physical cores. Others mean a guaranteed share of host capacity. Both can improve predictability, but they are not identical arrangements.
Pinning is not the same as exclusivity. Pinning restricts where a vCPU may run. To make those processors exclusive, the provider must also keep other guests off them. Ask whether the reservation covers the full physical core or a logical processor sharing that core through SMT.4
A dedicated server is clearer: the full physical machine belongs to one customer. You can run directly on the hardware or install your own virtualization layer; the provider is not allocating its CPU among unrelated customers. CPU generation, cooling, and software fit still matter. Exclusive access to a slow processor does not make it fast.
For a VPS, ask the provider five direct questions:
- Which exact CPU model runs the plan?
- Is the listed processing capacity shared, burstable, reserved, or dedicated?
- Can other customers use the same physical cores or SMT siblings?
- Do CPU caps, credits, or baseline limits apply?
- Can support inspect host-level contention during a reported slowdown?
A provider should be able to answer those questions plainly. You are asking what you are buying.
Test The Busy Version Of The Workload
The best comparison is not a synthetic score run once after the VPS has been idle. It is the trading workload repeated under representative pressure.

Run demanding comparisons in simulation or on a separate test VPS, not alongside live automation. The aim is to find the limits without discovering them during an active position.
Build a small test set:
- Record the provider-confirmed CPU model, vCPU count, memory, storage, platform version, workspace, and data range. The CPU name shown inside a VM may be generic.
- Time platform startup and full workspace readiness.
- Time the same historical backfill or Tick Replay load. Record whether data was downloaded or already cached locally.
- Run the same Strategy Analyzer job with fixed historical inputs and parameters. Keep any random seed fixed when the test supports it.
- Watch individual logical processors, process CPU, memory, and storage during each test.
- Repeat at quiet hours and during the periods that normally matter to your trading.
- Compare the median, the slowest run, and the spread between runs.

One fast result shows potential. A narrow spread across repeated runs shows consistency. Keep cold starts and cached reruns separate: otherwise, a storage or download difference can look like a CPU result.
Use the symptoms to guide the next check:
| What You See | What To Check Next |
|---|---|
| One logical processor stays busy while total CPU looks low | Single-thread performance and the platform’s ordered work |
| All guest vCPUs remain heavily used | Plan size, concurrent workloads and inefficient processes |
| The same job varies sharply with identical inputs | Host contention, burst policy, thermals, storage cache and background tasks |
| Storage activity rises while CPU waits | NVMe performance, disk queue and antivirus scanning |
| Network latency stays stable while charts or indicators hesitate | Platform processing, rendering and guest or host CPU pressure |
Live automation, tick-heavy workspaces, copy-trading nodes, several platform instances, and long research jobs place a high value on consistency. That is where a clear allocation policy becomes worth paying attention to.
A Practical Example: ChartVPS
ChartVPS Alpha and Gamma plans use dedicated vCores. The CPU capacity assigned to each VPS is reserved for that customer rather than shared between customers. The physical host still runs multiple virtual machines; dedicated allocation is not the same as owning the server.
The distinction matters when workloads overlap. On shared CPU, several customers running optimizations at once can compete for processor time. Dedicated allocation removes that source of contention, making sustained processing more predictable. It does not change how efficiently NinjaTrader or a particular script uses the capacity available.
That is the useful comparison: not simply how many vCores a plan lists, but what access to processing time those vCores represent.
Related Reading
- Why Single-Thread Performance Still Matters in Trading
- Latency Is Not Execution Speed
- Alpha CPU-Driven Trading VPS
- ServerIQ Monitoring
Sources
- Microsoft Learn, Manage Hyper-V Hypervisor Scheduler Types. ↩ ↩
- Red Hat, Optimizing Virtual Machine Performance, section 17.6.1 on vCPU overcommitment. ↩ ↩
- Microsoft Learn, Detecting Bottlenecks In A Virtualized Environment. ↩ ↩
- Microsoft Learn, Virtual Machine Resource Controls. ↩ ↩
- Google Cloud, General-Purpose Machine Family For Compute Engine, section on E2 shared-core VMs and CPU bursting. ↩ ↩
- Amazon Web Services, Key Concepts For Burstable Performance Instances. ↩ ↩
- NinjaTrader Developer Docs, Calculate. ↩
- NinjaTrader Developer Docs, Developing For Tick Replay. ↩
- Linux Kernel Documentation, The /proc Filesystem, section 1.7 on /proc/stat. ↩