

Suppose you come back to the desk after leaving a strategy to run through the morning. The VPS responds immediately. Windows is fine. Your platform is still open, exactly where you left it.
There have been no trades.
That might be correct. Your entry conditions may never have arrived. But it might also mean the strategy stopped after a connection problem, its trading permission changed, or the data it depends on stopped updating.
From the server’s point of view, it has been an uneventful morning.
This is the gap worth understanding before you leave a trading setup unattended. Infrastructure uptime tells you something important about the machine. It cannot, on its own, tell you whether your trading workflow is doing what you intended.
The answer is not to watch another dashboard all day. It is to decide what needs to remain true, arrange checks for those conditions, and know what to do when one fails.
What the Green Light Checked
A useful status indicator answers a specific question. Trouble starts when we treat the answer as broader than the check behind it.
An external reachability check might establish that the server responds. A process check establishes that a named program is present. Neither establishes that the program is processing current market data or that a strategy is permitted to submit orders.
Even a responsive window has a limited meaning. Microsoft’s process documentation distinguishes whether a user interface responds to Windows messages from simply having a running process. That is a useful additional check, but it still says nothing about the correctness of a trading calculation.1
Separate the questions:
| Check | What It Can Establish | What It Does Not Establish |
|---|---|---|
| Server reachability | A response arrived from the monitored endpoint | Every connection used by the platform is working |
| Platform process | The selected program is running | Its charts, scripts, and strategies are making progress |
| Data freshness | The required stream has delivered a recent update | The strategy consumed that update successfully |
| Strategy state | The strategy reports the expected operating state | An order was accepted or filled |
| Broker account and orders | The connected account reports positions and order states | Those states match what the strategy intended |
You do not need an institutional operations desk to make these distinctions. Start with your own setup: which platform, which account, which instruments, which automation, and which connections? That gives each check a job.
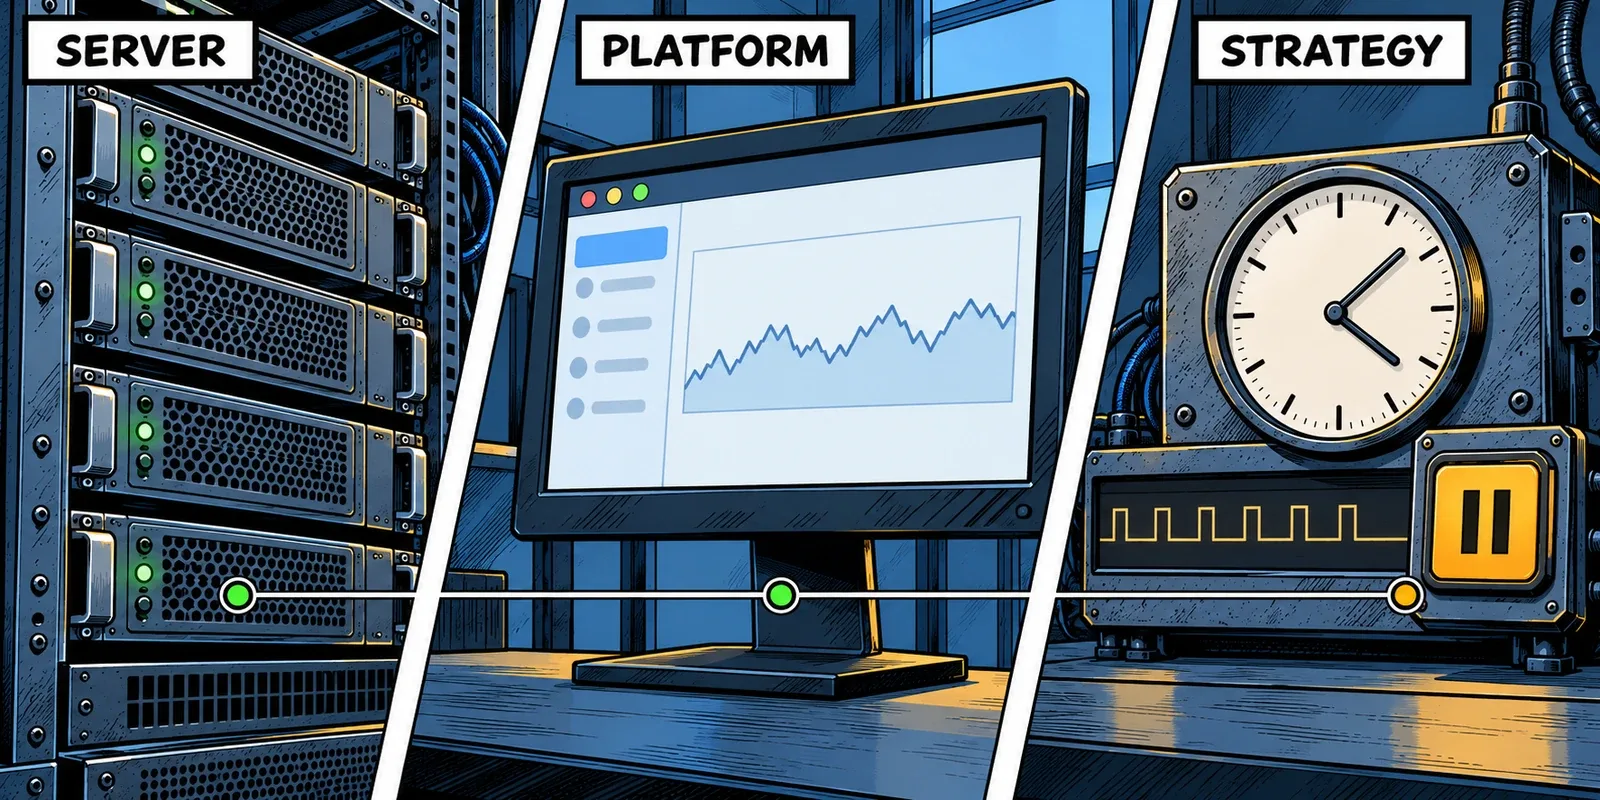
A running process tells you the application is there. It does not tell you what the application is getting done.
An Open Platform Can Still Be Waiting
MetaTrader 5 provides a particularly clear example. Disabling Allow Auto Trading can leave an Expert Advisor running while preventing it from sending trade requests. Platform-wide permission and the individual EA’s permission both matter.2
MetaQuotes also documents that the EA’s OnTick() handler can continue to receive events when automated trading is disabled. In plain terms: an EA can still react to incoming prices without being allowed to trade.3 Watching activity on the chart would not tell you the whole story.
NinjaTrader makes another distinction after a lost connection. Its strategy settings offer Keep Running, Recalculate, and Stop Strategy behaviours. With Stop Strategy, restoration of the connection does not itself restart the strategy. Other behaviour depends on the selected settings and circumstances of the interruption.4
These are deliberate controls, not evidence of defective infrastructure. A stopped strategy may be doing exactly what its owner configured it to do. Automatically turning everything back on would not necessarily be an improvement.
For the trader returning to the desk, the next question is therefore more useful than “Is NinjaTrader open?”: Is the intended strategy enabled, on the intended account, in the state expected for this session?
Check the platform’s strategy status and relevant logs. An intentional session filter, an internal risk limit, a waiting state, and an unexpected disablement should not all be described as “the bot stopped.” If a third-party strategy does not explain its state clearly, ask its developer what evidence distinguishes normal waiting from a fault.
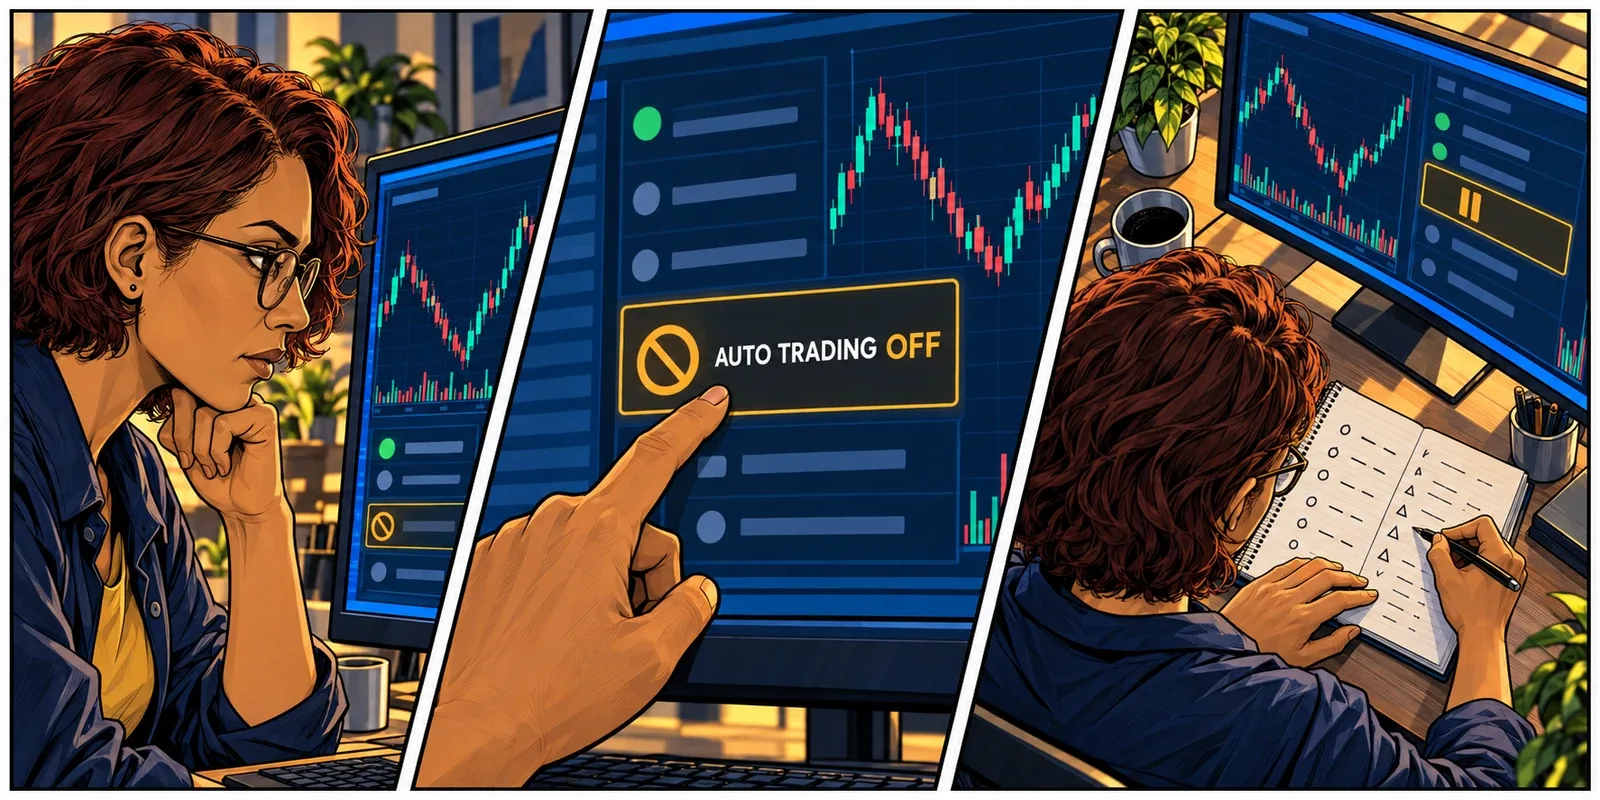
No trades can be the right result. What you need to know is whether the strategy was in a position to make that decision.
Look for the Last Useful Update
A connection indicator is a starting point. For a data-dependent strategy, freshness is more revealing: when did the input this strategy needs last update?
Consider a futures setup that uses both trades and market depth. Recent trades on one chart do not establish that the depth subscription is current. A multi-instrument strategy needs its required instruments checked, not just whichever chart happens to be visible.
A practical monitoring design records separate times for the latest required data and the latest completed strategy evaluation. The first helps identify a missing input. The second helps identify work that is no longer finishing. This generally needs support from the strategy or an integration; a hosting process monitor cannot infer it from the program’s name.
Developers sometimes add a heartbeat, a periodic message showing that some part of the software is alive. That is helpful, provided the message describes the right part. A timer can keep reporting while another component is waiting on data. Prefer a record that includes the last completed evaluation and data age, rather than just a fresh “alive” timestamp.
Even the timer’s delivery depends on implementation. MQL5 processes events through a queue and does not add another Timer event when one is already queued or being handled.5 A heartbeat interval is an intended cadence, not proof that every callback happened on schedule.
Freshness also needs market context. A scheduled session break or a thinly traded instrument can be quiet without anything failing. Define expectations around the feed, instrument, and session. Do not use “no new price for a few seconds” as a universal restart rule.
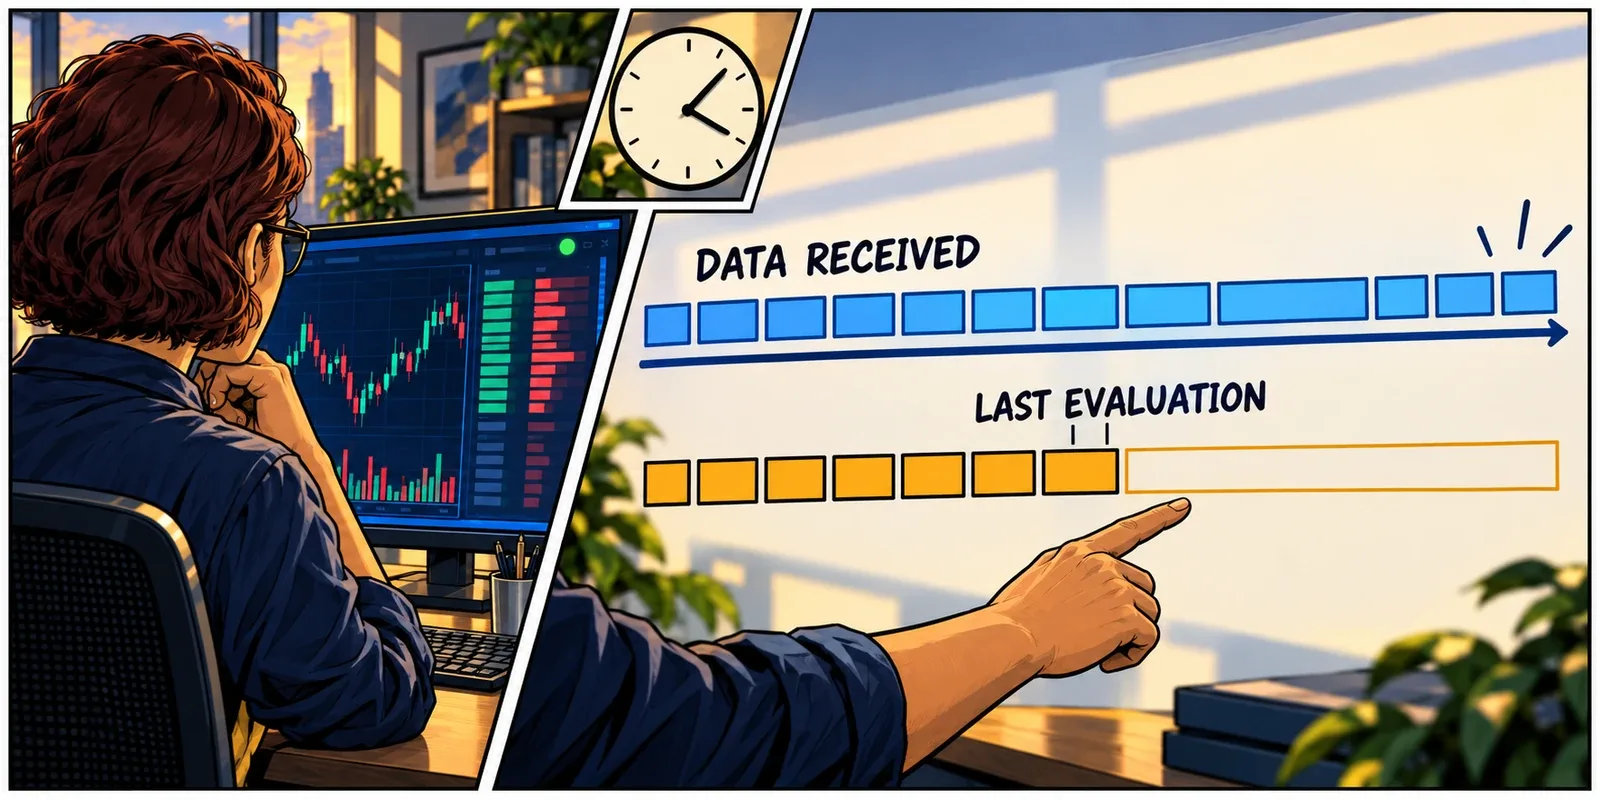
“Connected” is a connection state. “Updated” needs a timestamp.
A Quiet CPU Graph Can Hide a Busy Thread
Resource monitoring earns its place when you connect it to an observed interruption. Start with the time the chart fell behind or the strategy stopped reporting progress, then examine what the machine was doing around that moment.
The headline CPU percentage can be misleading. Microsoft’s Task Manager guidance uses an eight-logical-processor example: one processor’s full capacity represents 12.5% of the total. A demanding sequential task can therefore run out of processing headroom while the overall figure looks modest. View the logical-processor graphs and the relevant process, rather than relying on the average.6
That is an illustrative capacity calculation, not a diagnosis from a single number. Windows can move a thread between logical processors, and real workloads contain other activity. The useful observation is sustained pressure associated with the work that is falling behind.
Memory and storage deserve the same context. Compare a problem during a large history load with available memory, disk activity, and remaining space. A nearly full drive and a drive busy serving reads are different conditions, even if both appear under a storage heading. Ask which measurement the alert refers to.
Avoid declaring a hardware fault because a graph became busy. An optimization deliberately uses compute capacity. A live strategy unexpectedly competing with that optimization is a scheduling or capacity question. Put the workload beside the metric before changing either.
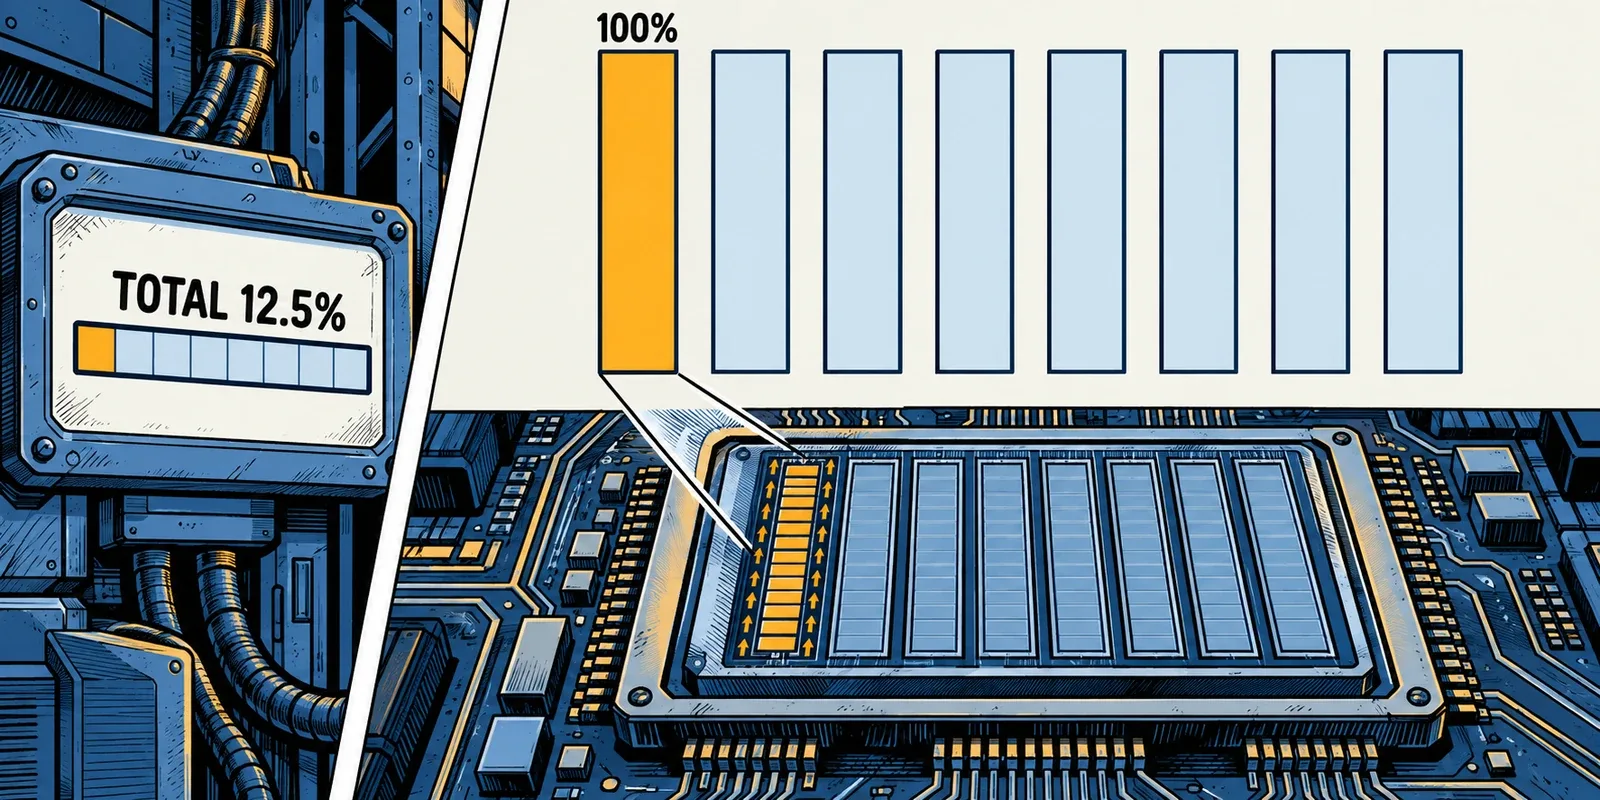
Spare capacity elsewhere in the machine does not guarantee spare capacity in the part your strategy is waiting for.
Make Alerts Worth Interrupting You For
An alert should leave you with a useful next action. “Something changed” rarely does.
Google’s site-reliability guidance makes a practical distinction between symptoms and causes, and warns about the attention cost of noisy alerts.7 Applied to a trading setup, that means a stopped platform, stale required data, and high CPU usage deserve different messages. They describe different evidence and call for different checks.
For example, a process alert might say:
Execution VPS: the monitored platform process is no longer present. Detected at 09:34:12 America/New_York. Last seen at 09:34:07. Server remains reachable. Check the platform event history and broker account before resuming automation.
Those names and times are illustrative, not a measured incident or a delivery promise. The value is the context: which machine, what failed, when it was observed, and what remained available.
For your own rules, separate urgent interruptions from conditions worth reviewing later. Repeatedly warning about expected backtesting load teaches you to dismiss the messages. Do not apply that same tolerance to a process disappearing unexpectedly during its scheduled operating window.
There is another dependency to check: how will you learn that the monitoring stopped? An agent running inside an unavailable VPS may be unable to send anything. Ask whether the monitoring service detects missing reports from outside that machine. Test the notification route too; an event in a dashboard and a message delivered to your phone are different outcomes.
Choose a recipient and a backup contact where appropriate. If nobody knows who is responding, the alert has only documented the problem.
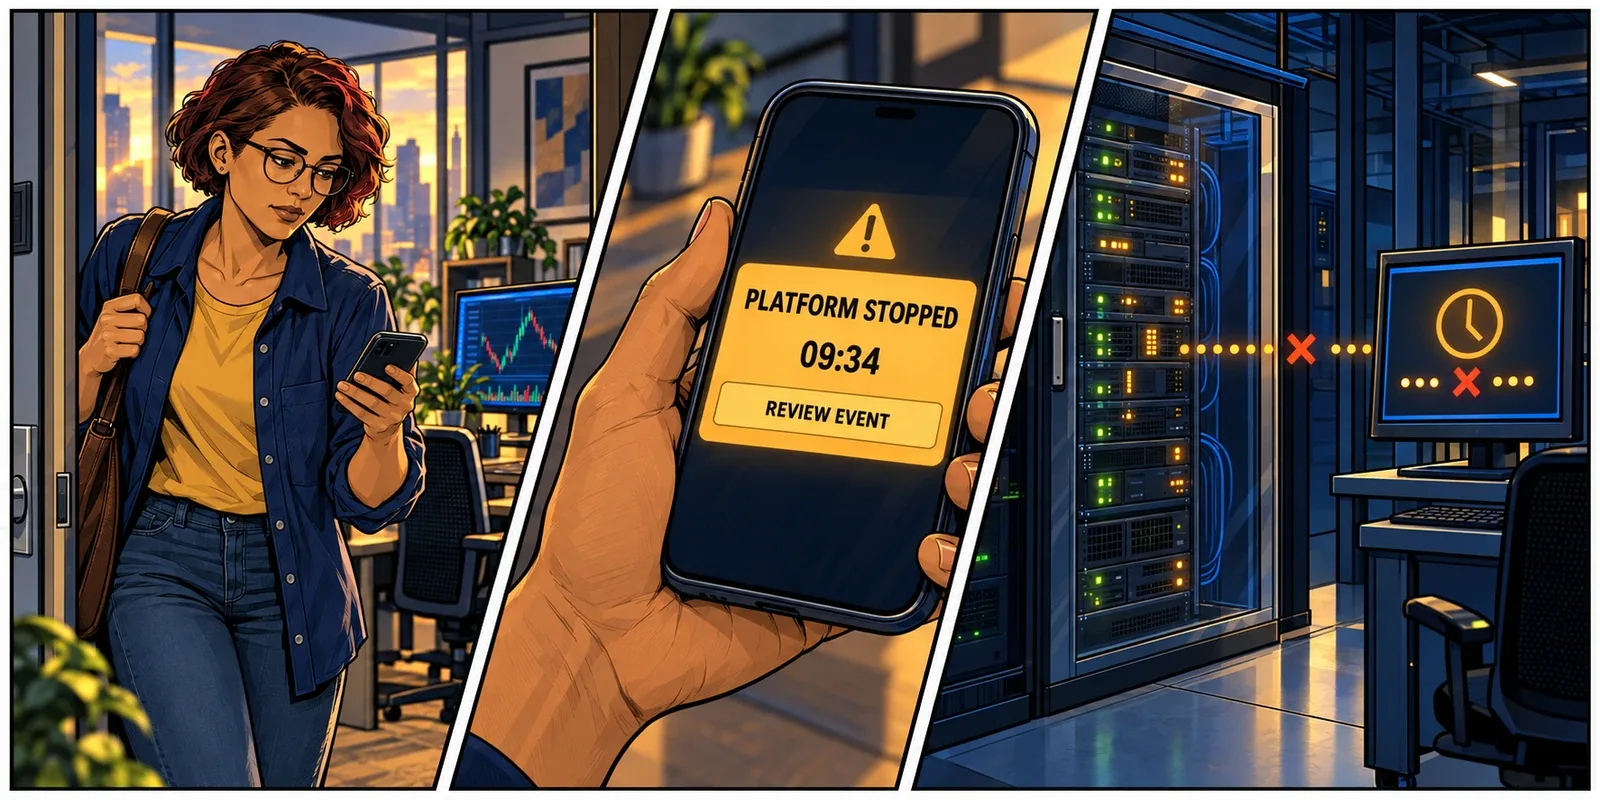
The useful alert is the one that tells you what needs attention and gives you somewhere sensible to start.
Restarting Is an Action, Not a Diagnosis
When a platform looks stuck, restarting it is tempting. Sometimes that is part of the right response. With automation, though, restoring a window and restoring the intended trading state are separate tasks.
NinjaTrader explicitly distinguishes a strategy position, maintained by the strategy, from the account position held in the trading account. Historical processing, manual activity, and multiple strategies can make that relationship more complicated than the last chart marker suggests.8
Its startup documentation also warns that synchronizing an account can place or close live trades. Startup synchronization does not guarantee that the states remain aligned afterward.9 Do not treat a synchronization option as a harmless refresh button.
Before restarting or resuming an affected setup, follow the recovery procedure agreed for that platform and strategy:
- Establish the current broker-side positions and working orders through a functioning, authenticated route. If visibility is uncertain, use the broker’s support procedure rather than guessing.
- Confirm which protective orders are broker- or exchange-held and which depend on the local platform continuing to run. Verify this with the broker and software provider for the order types you use.
- Preserve relevant logs and timestamps when doing so does not delay urgent risk handling. Confirm who is controlling the account and prevent an unintended second automation instance.
- Resume only after checking data, permissions, strategy state, and the documented startup behaviour. Observe the return instead of assuming it succeeded.
This is preparation for an operational interruption, not a recommendation to cancel orders, flatten positions, or select a particular trading setting. Those decisions belong to your established risk procedures.
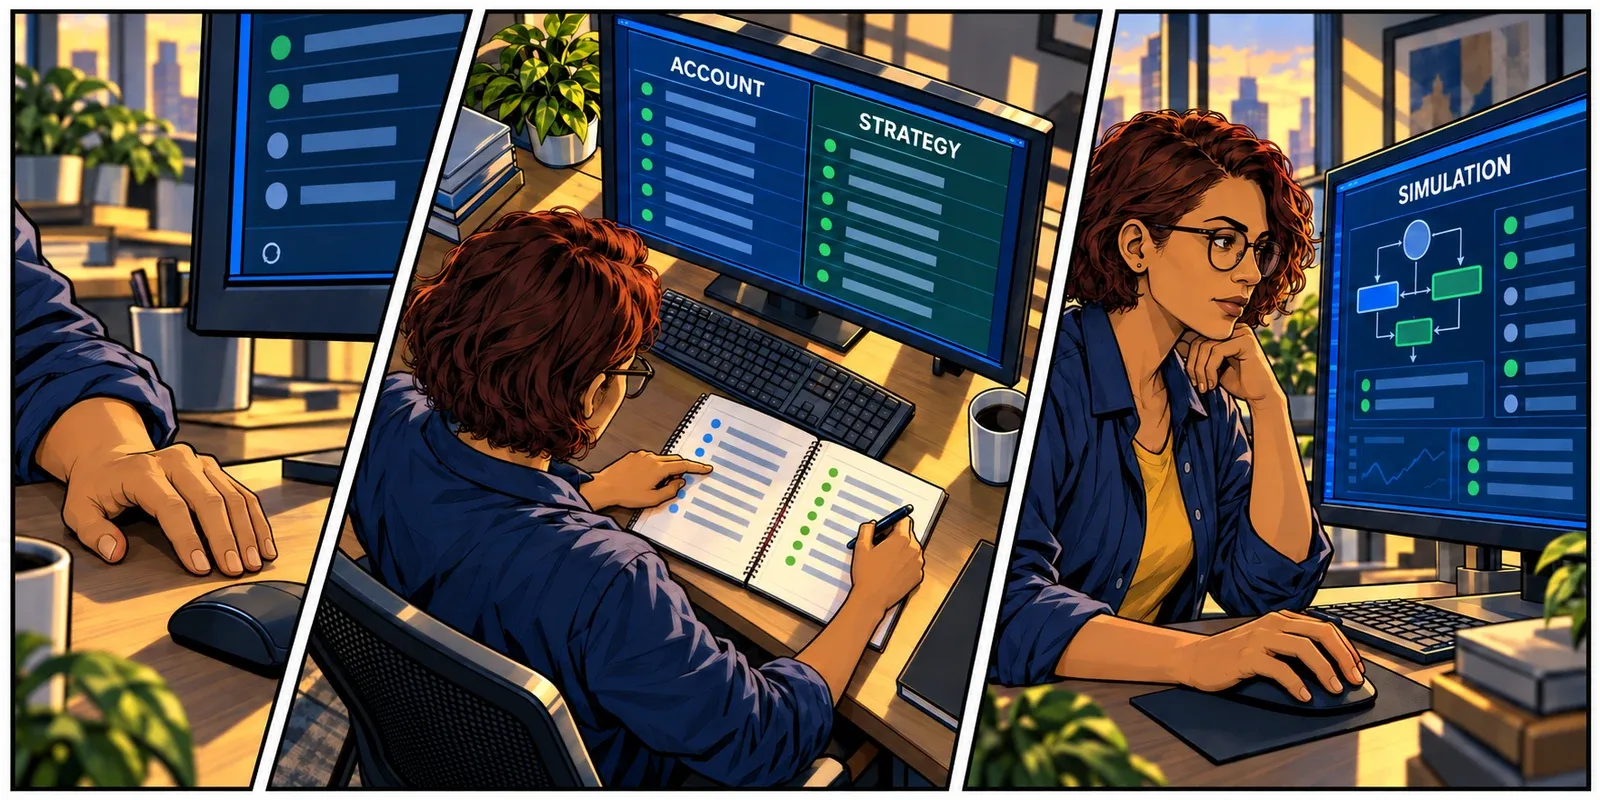
A successful restart is not the same as a verified return to trading.
Leave the Desk With a Routine, Not a Guess
Put the checks into a short routine you can repeat before unattended operation. It should identify the account and strategy, confirm required data is current, verify the intended permissions, and establish that notifications reach the person responsible. Record the platform and strategy versions so changes have a traceable starting point.
Then rehearse the failures in a simulation or other isolated test environment. What happens after a connection interruption? Does a process-stop alert arrive? After a planned restart, which parts return automatically and which wait for you? Do not create an outage in a live account just to find out.
There is a useful role for the hosting provider here. At ChartVPS, ServerIQ is included with every plan and monitors server resources, restarts, shutdowns, and selected Windows processes. Its threshold and process alerts give clients and support a record to investigate when the operating environment changes. Existing clients can ask support to activate it and set the relevant thresholds.10
That is infrastructure and process visibility. It should be paired with the platform’s own status and logs, and with strategy-specific checks where available. A running-process check does not validate your entry conditions, prove market data is current, or reconcile a broker position. Those need evidence from the systems that know them.
Agree on that division before there is a problem: what hosting support watches, what the platform reports, what the strategy developer exposes, and who makes the decision to resume.
Return to the quiet morning. No trades may have been exactly right. With the right checks, you can establish that the inputs arrived, the strategy evaluated them, and its controls behaved as intended. Without those checks, you are trying to infer all of that from an open window.
Being able to leave the desk starts with knowing what will bring you back to it.
Related Reading
- Why Single-Thread Performance Still Matters in Trading
- Dedicated CPU vs Shared vCPU: What Your Trading Platform Actually Gets
- Latency Is Not Execution Speed
Sources
- Microsoft Learn, Process.Responding Property. ↩
- MetaTrader 5 Help, Platform Settings: Expert Advisors. ↩
- MetaQuotes, OnTick: Event Handling. ↩
- NinjaTrader Help Guide, Strategy Settings: Connection Loss Handling. ↩
- MetaQuotes, OnTimer: Event Handling. ↩
- Microsoft Learn, Troubleshoot Processes by Using Task Manager. ↩
- Google, Site Reliability Engineering: Monitoring Distributed Systems. ↩
- NinjaTrader Help Guide, Strategy Position vs. Account Position. ↩
- NinjaTrader Help Guide, Syncing Account Positions. ↩
- ChartVPS, ServerIQ: Trading Server Monitoring and Alerts. Product scope checked October 1, 2026. ↩