


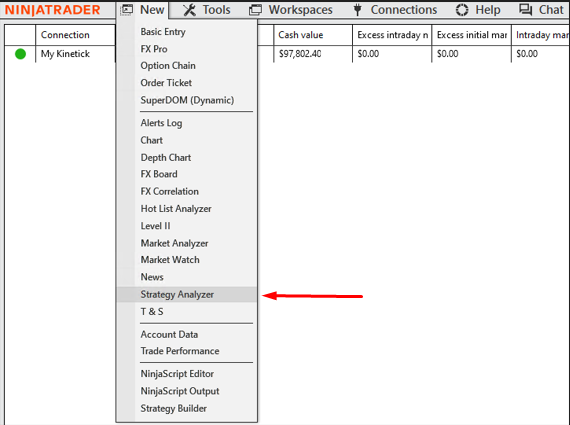
How to access Strategy Analyzer:
In the NinjaTrader Control Center, click on the ‘New’ menu and select ‘Strategy Analyzer’ from the dropdown list.
Explanation of Strategy Analyzer window:
The Strategy Analyzer window is divided into several sections:
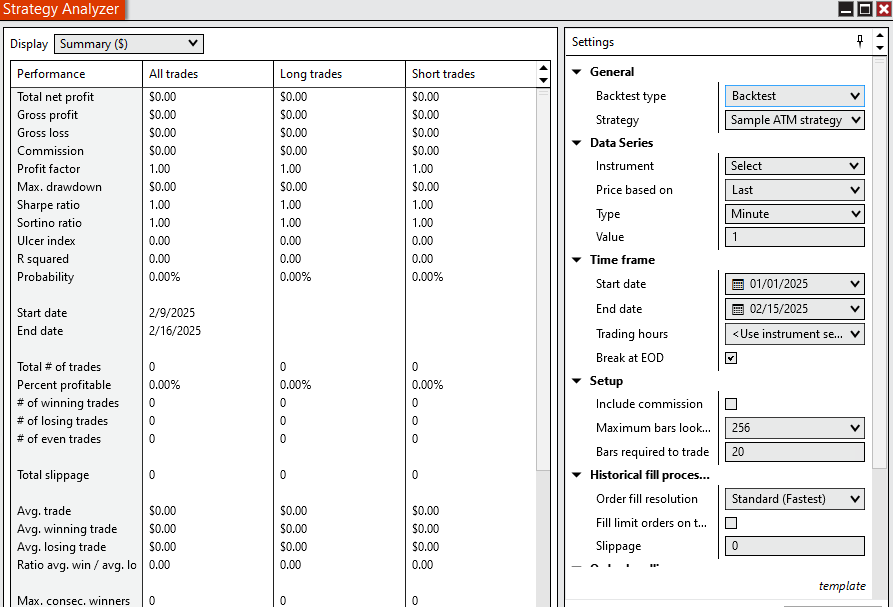
Performance Results Panel (Left Side)
This panel displays the results of your strategy’s backtest, including key performance metrics.
Key Metrics Explained:
Total Net Profit: Overall profit or loss from the strategy.
Gross Profit & Gross Loss: Total earnings and losses before commissions.
Profit Factor: Ratio of gross profit to gross loss (greater than 1 is favorable).
Max Drawdown: The biggest peak-to-valley decline in your account balance.
Sharpe Ratio: Measures risk-adjusted returns. Higher values indicate better performance.
Sortino Ratio: Similar to Sharpe but only considers downside risk.
Trade Statistics: Includes the number of winning, losing, and break-even trades.
Slippage & Execution Costs: Displays trade execution factors affecting performance.
This section helps traders evaluate whether their strategy has been historically profitable and whether it meets their risk tolerance.
Settings Panel (Right Side)
This panel is where users configure backtests by selecting instruments, time frames, and other parameters.
General:
Backtest Type: Here you can choose between Backtest, Optimization, or Walk-Forward Analysis.
Strategy: Select a predefined or custom strategy to test.
Data Series:
Instrument: Select the financial asset (e.g., stocks, forex, futures).
Price Based On: Choose Last Price, Bid, or Ask.
Time Frame:
Start & End Date: Define the period for the backtest.
Trading Hours: Set market session hours.
Break at EOD: Choose whether to close positions at the end of the trading day.
Setup & Execution:
Include Commission: Factor in trading fees.
Order Fill Resolution: Determines trade execution speed (Standard = fastest).
Slippage: Simulates market impact on trade execution.
Backtesting a Strategy:
First, in the Strategy Analyzer window, select the desired instrument and strategy. After that, configure the strategy parameters, such as time frames and order quantities. In the end, click ‘Run’ to execute the backtest.
After test has been completed, review the results to assess the strategy’s historical performance.
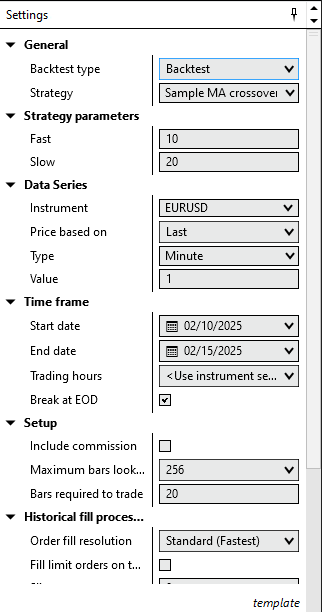
We’ve chosen these parameters for testing purposes:
- Strategy: Simple 10-period vs. 20-period moving average crossover.
- Instrument: EUR/USD
- Timeframe: 1-minute.
- Date Range: Last 3 to 5 days.
- Order Fill Resolution: Standard (Fastest).
- Max Bars Lookback: Set to 256 (avoid infinite lookback).
Reviewing Performance Results:
The results are here, let’s review them.
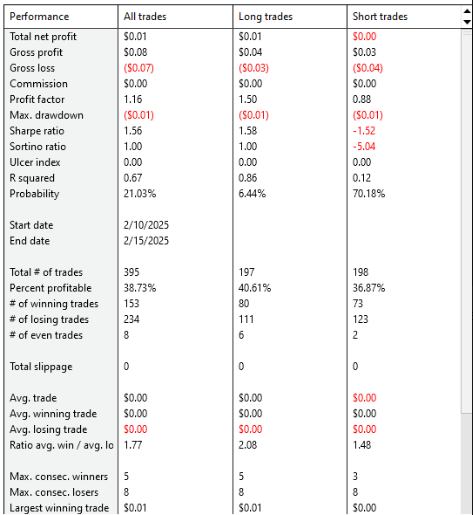
Overall Performance (All Trades)
✅ The strategy was slightly profitable but nearly breakeven with total net profit $0.01.
✅ Profit Factor was at 1.16 – this is a positive sign, but ideally, this should be above 1.5 for a strong strategy.
⚠️ Max Drawdown: ($0.01) – Very low, which is good, but this might indicate low trade volume or position sizing. This could be due to low position sizing or a small number of trades with real impact. To improve this we could test it on larger dataset
✅ Sharpe Ratio was 1.56 – A solid risk-adjusted return.
Trade Statistics
✅ Total Trades: 395 (Sufficient data for evaluation)
Thorough testing and analysis are crucial before deploying any automated trading strategy in live markets.
