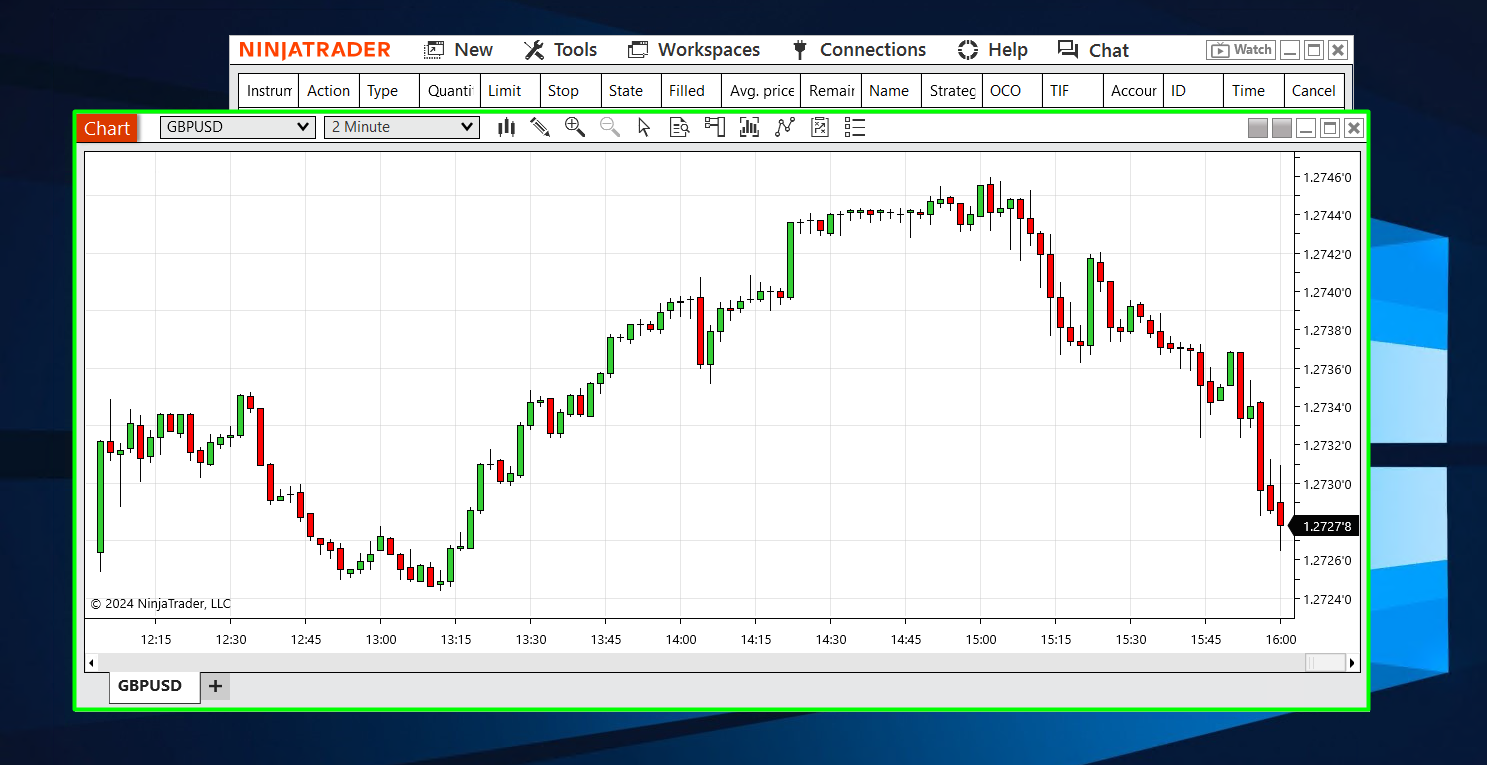
In this guide- you will learn how to add the chart you want to track in your NinjaTrader app.
Charts in NinjaTrader are essential tools for traders to visualize market data, analyze price movements, and make informed trading decisions
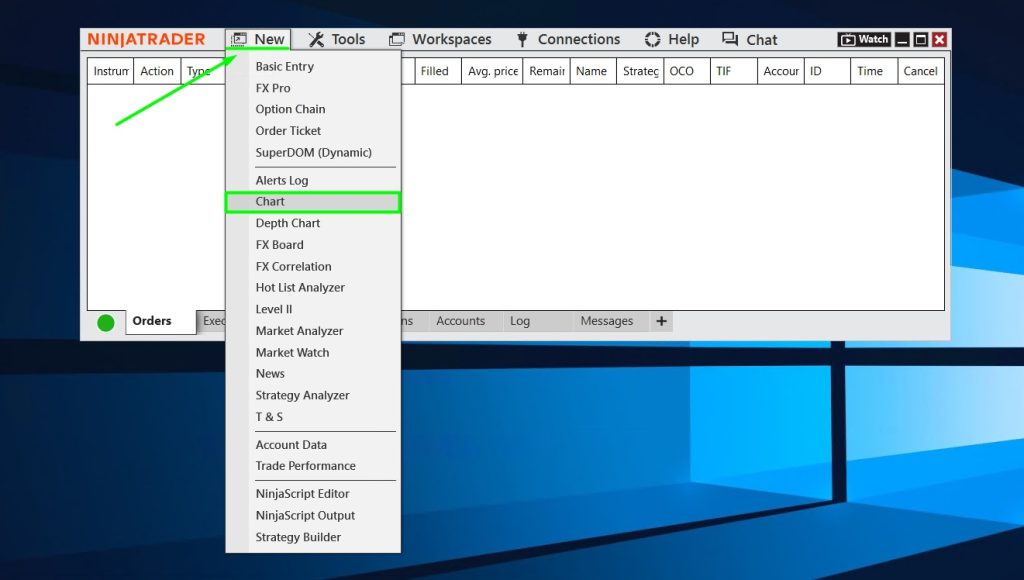
- Once you open your NinjaTrader app- click on the NEW tab, then select CHART:
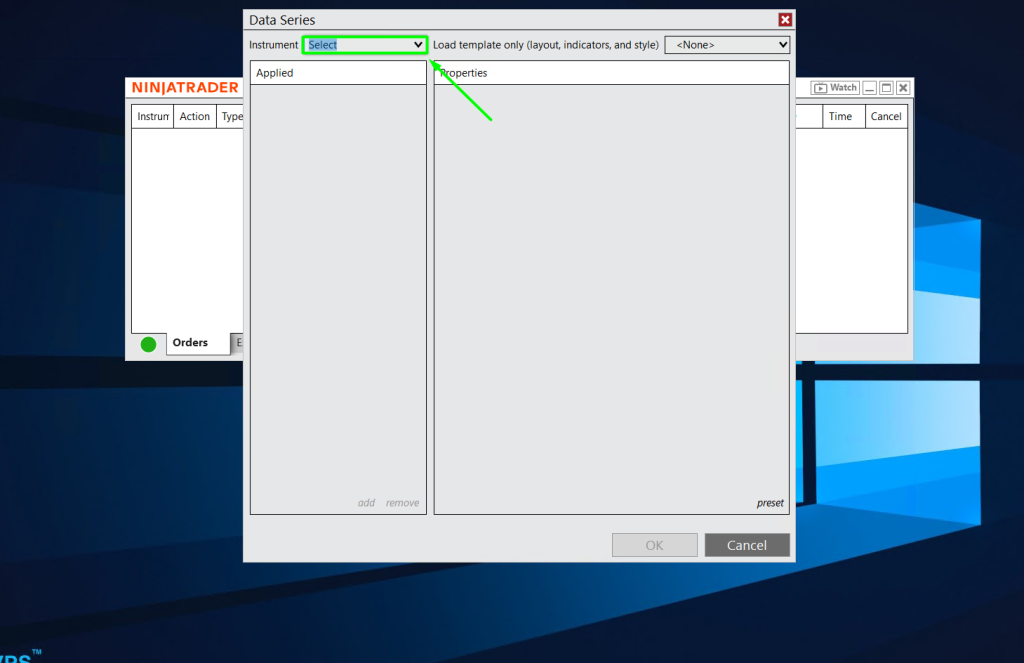
- Then you can type the name of the instrument you want to track:
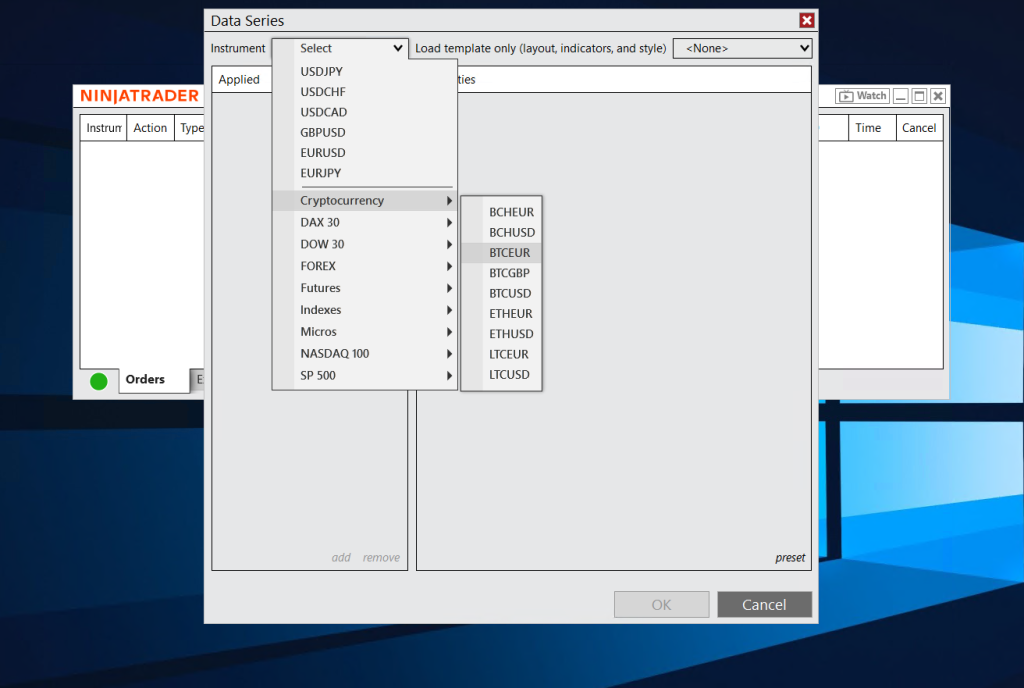
- Or find the instrument from the drop-down menu. In our case, we chose BTCUSD:
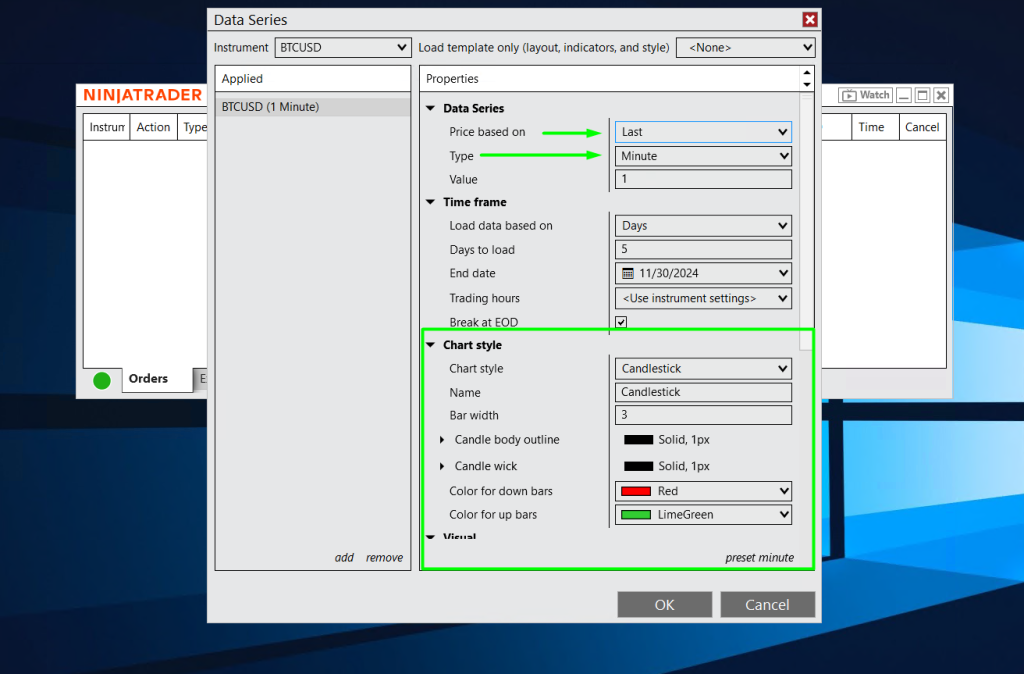
- Once you add the instrument- you can customize the chart you selected. Pick a parameters, style, colors, etc:
- Once you click OK chart will appear like this:
