Est. 2013 · Global Trading Infrastructure
Infrastructure as a Trading Edge
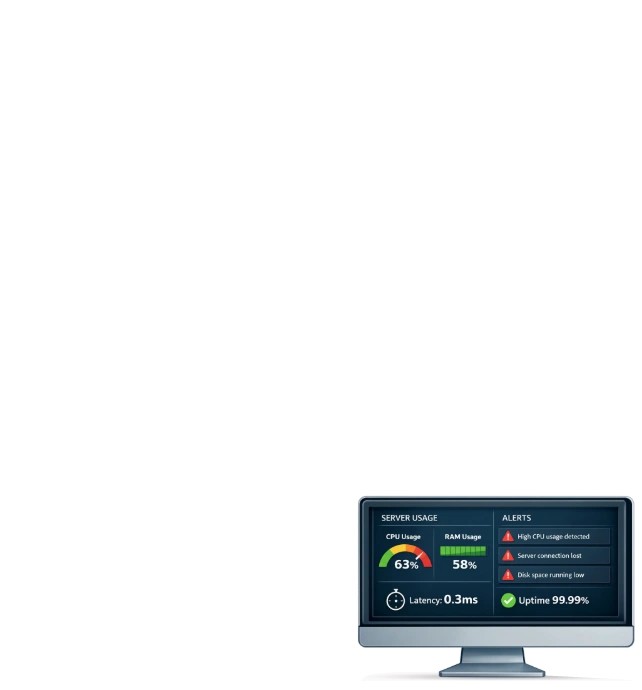
Ranked in the top 1% of the world's fastest VPS, with 0-1ms execution latency and real, audited 99.99% uptime. Built to keep your trading platforms and strategies fast, stable, and online when execution matters most.

Eight Reasons Traders Choose ChartVPS for Financial Hosting
Pricing
Managed Infrastructure Plans

Alpha Series
CPU-first trading VPS
CPU Driven
AMD Ryzen 9 9950X
Specifications
Highlights

Gamma Series
GPU-assisted trading VPS
GPU Acceleration
Up to 70% Higher Performance
Specifications
Highlights

Delta Series
Dedicated server
Bare Metal
Entire Server · No Virtualization
Specifications
Highlights
Trading Platform Fluency
Infrastructure
Performance Hardware
Every component has a job: keep trading platforms responsive under load. Dedicated resources mean the cores on the plan are the cores your platform gets. Novel idea, apparently.
Top 1%
PassMark Score
Gen4
NVMe SSD
NVIDIA L4 GPU|7,424 CUDA Cores
AMD Ryzen 9 9950X|Top 1% PassMark
Gen4 NVMe Storage|7,000 MB/s read5,000 MB/s write
DDR5 ECC RAM|High Bandwidth
Dedicated CPU Cores|No Overselling
Hardware Refresh|Current Cycles
Performance Benchmarks
We benchmark plans because "fast" is not a spec. Compare CPU, GPU, and distributed performance before you pick the machine your trading day depends on.
Learn More about our infrastructureNetwork
Low-Latency Network Paths
0-1ms
Typical latency to CME Chicago

3 Gbps
Sustained Network

10 Gbps
Burst Connectivity

99.99%
Measured Uptime + 100% SLA

Low latency is not one magic cable. It is location, routing, redundancy, and a network designed around trading paths. Chicago customers can see 0-1ms typical latency to CME.
Locations
Trading Data Centers

Chicago
0-1ms latency to CME and CBOT

New York
0-1ms latency to NYSE and NASDAQ

London
0-1ms latency to LSE and FX brokers

Frankfurt
0-1ms latency to DAX

Singapore
0-1ms latency to SGX

Tokyo
0-1ms latency to TSE and Binance

Dallas
0-1ms latency to TXSE and NYSE Texas

Hong Kong
0-1ms latency to HKEX & Asia-Pacific markets

Managed Layer
Services & Add-Ons
ChartVPS ServerIQ
Monitor CPU, RAM, network stability, platform activity, and key Windows processes from one place. If NinjaTrader freezes or disk usage gets ugly, ServerIQ emails you before your trading day turns into archaeology.
Included with
All Plans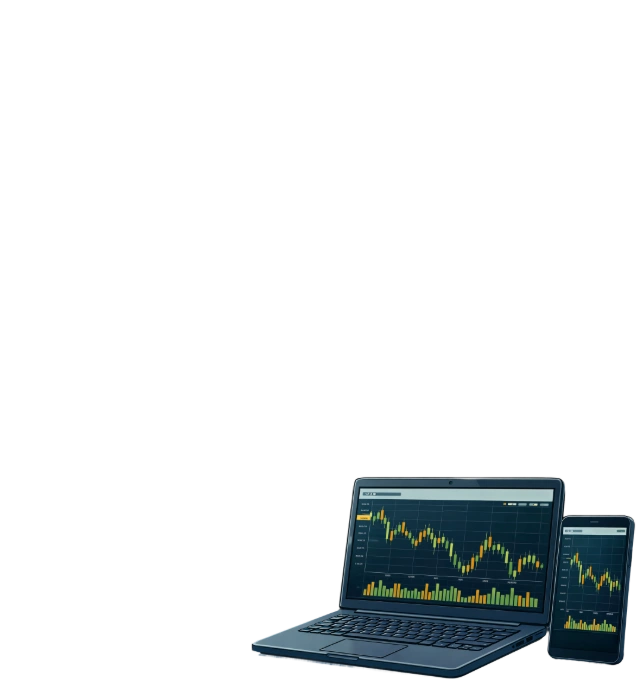
ChartVPS TradeCopy
Run a lead NinjaTrader and Replikanto workspace on a master VPS, then mirror it to copy nodes over a private 0-1ms ChartVPS network. Built for professional, prop, and social-copying workflows that need room to add accounts.

Daily Snapshot (Backup)
Automated daily snapshots protect your workspace, platform settings, and data. Encrypted off-server storage. Full-system recovery target: under 2 hours. Unlike other hosts, this protection is included with all ChartVPS plans.
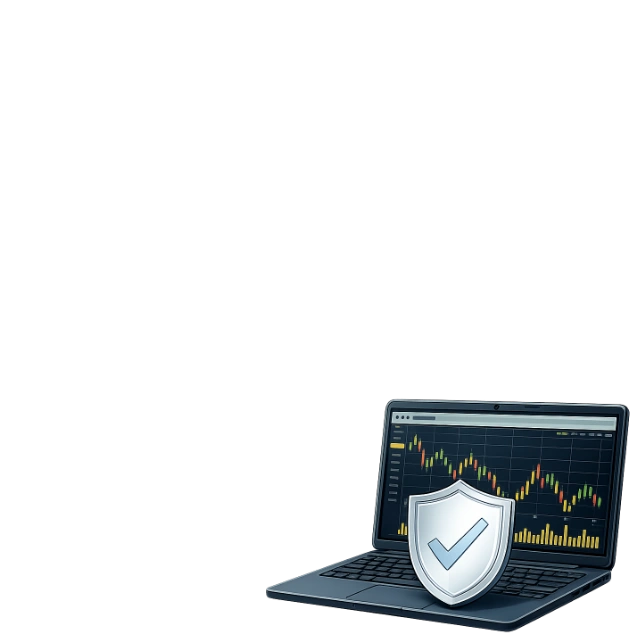
DDoS Protection
Always-on DDoS protection helps keep attacks away from the trading environment. Layered mitigation, continuous monitoring, and less drama than discovering a volumetric attack during the open.
Human-First Support
Real Engineers. Real Answers.

NORTH AMERICA TEAM
New York • Canada • Los Angeles
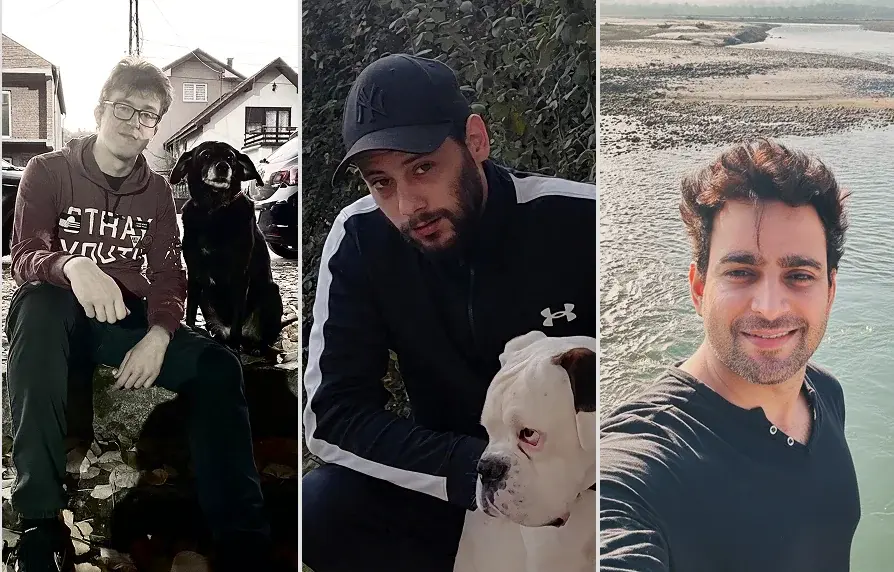
EUROPEAN TEAM
London • Serbia • Amsterdam

ASIA-PACIFIC TEAM
Tokyo • Singapore • Philippines
24/7 Human Coverage
Our support coverage follows the trading day around the world. When you need help, a qualified human answers in under 2 minutes.
Trading Platform Fluency
We know the difference between a server issue, a platform issue, and a trader having a very bad morning. That matters when the market is open.
Humans, Not Scripts or Bots
No chatbot maze. No canned script pretending to help. A real engineer can remote into your VPS and fix the thing.
NORTH AMERICA TEAM
New York • Canada • Los Angeles
24/7 Human Coverage
Our support coverage follows the trading day around the world. When you need help, a qualified human answers in under 2 minutes.
EUROPEAN TEAM
London • Serbia • Amsterdam
Trading Platform Fluency
We know the difference between a server issue, a platform issue, and a trader having a very bad morning. That matters when the market is open.
ASIA-PACIFIC TEAM
Tokyo • Singapore • Philippines
Humans, Not Scripts or Bots
No chatbot maze. No canned script pretending to help. A real engineer can remote into your VPS and fix the thing.
Reviews & Responsibility
Reputation & Impact
"First class service. I had a dedicated server for trading. The support I received was top notch. Not many companies around actually investing in customer service anymore but the ChartVPS team is dedicated. When I had non-server related issues they took the time to help me figure it out. Nothing but admiration for this company and if you need a VPS they’ll hook you up and support you along the way."
KW
First Class Services
"I’ve been trading for over seven years and went through 3 trading computers before discovering ChartVPS. ChartVPS has become my trading partner. I say this because I no longer need to buy nor worry about maintaining a computer for trading. And, to keep up with my trading needs, I was recently able to upgrade computer power on my first server and add a second ChartVPS server to begin trading."
BB
My Trading Partner

A company that wants trust from customers should start by being fair to its own people. Equal opportunity, equal pay, and above-average compensation are part of the operating model.

We donate at least 1% of profits to charities and non-profits focused on climate, wildlife, and social justice. If your organization fits that work, get in touch.

Infrastructure uses power. Pretending otherwise would be silly. We work toward lower-impact operations through renewable energy, carbon offsetting, and more efficient infrastructure practices.
Our customers
Trusted By Leading Institutions