


Hello Tape Reading
Tape reading is like eavesdropping on a financial conversation. You’re not just watching numbers; you’re interpreting the intent behind every trade. Let’s break it down with precision, practical examples, and a touch of tongue-in-cheekness.
The Basics: What’s on the Tape?
- Price: The last trade price.
- Volume: Number of shares/contracts traded.
- Order Flow: The sequence of buy and sell orders.
- Time and Sales Data: Detailed list of executed trades showing price, volume, and time.
Imagine you’re at a lively southern barbecue, listening to snippets of, both, scandalous and pedestrian conversation. Tape reading is about figuring out who’s flirting with whom (buyers and sellers) and who’s likely to leave the party with someone (market moves).
Time and Sales: The Party Play-by-Play
Time and Sales is the real-time display of all the trades that have occurred for a particular security. It shows the price, volume, and exact time of each trade. Think of it as the play-by-play commentary of our barbecue bash, where each trade is a little interaction at the party.
For example, imagine you’re at this barbecue and you see that every few seconds, someone is grabbing a piece of that delicious peach cobbler. First, it’s a slice here (trade at $150.50 for 100 shares), then another there (trade at $150.55 for 200 shares), and so on. This consistent action gives you a sense of how popular that cobbler (or stock) is, much like how time and sales data gives you a sense of trading activity.
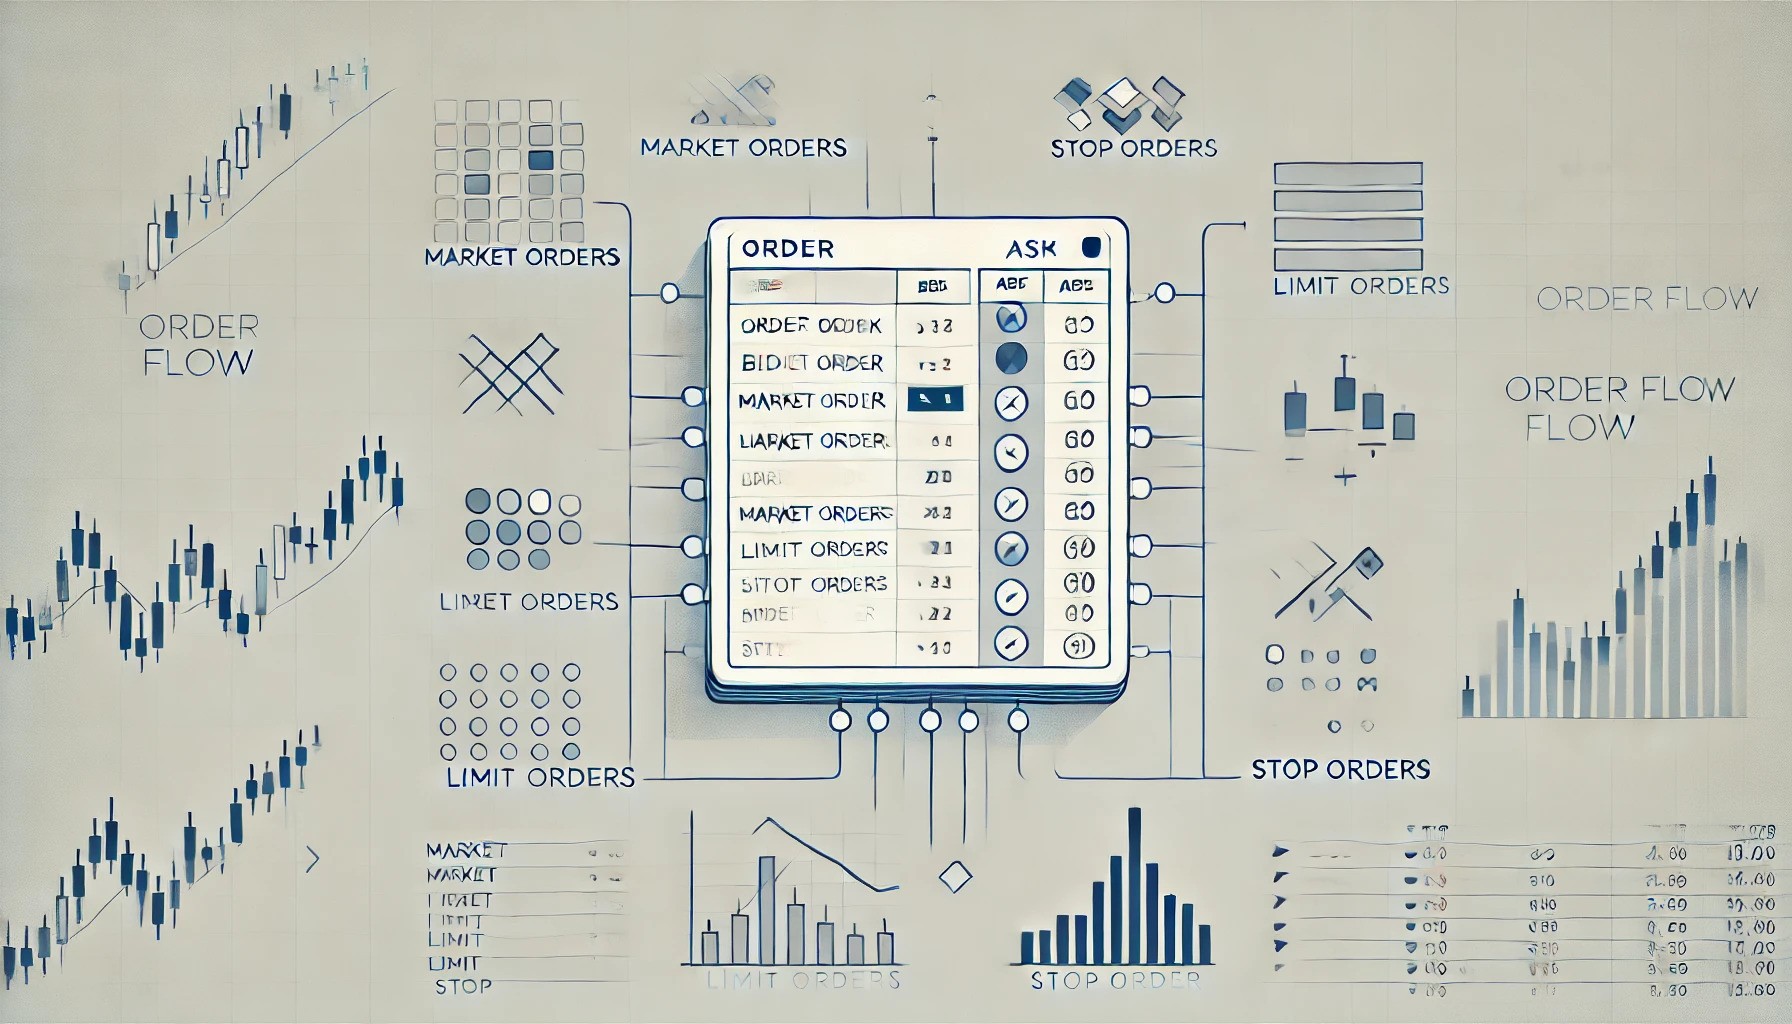
Introducing the Order Book
The order book is like the guest list at our party. It shows all the buy and sell orders waiting to be executed. The bids (buy orders) are on one side, and the asks (sell orders) are on the other. Understanding the balance between them can give you clues about the market’s next move.
Key Concepts in Tape Reading
1. Order Types and Flow
There are two main order types you need to be aware of:
- Market Orders: Executed immediately at the best available price.
- Limit Orders: Executed at a specified price or better.
Market orders are the life of the party—always moving, always active. Limit orders are more like folks sipping sweet tea, waiting for the right moment.
2. Volume Analysis
Volume tells you the strength behind a move. Big volume is like a crowded dance floor—there’s momentum and energy. Low volume is a few couples swaying in the corner—not much action.
3. Bid-Ask Spread
The bid is the highest price a buyer is willing to pay, and the ask is the lowest price a seller is willing to accept. A tight spread is like a smoothly run party; a wide spread means there’s some awkwardness and hesitation.
Advanced Tape Reading Techniques
1. Reading Large Orders
Large orders stand out like a tall guy at a concert. They can indicate institutional activity and potential market direction.
Example: Imagine you’re watching Apple (AAPL) and you see several large buy orders at $150.00, each for 10,000 shares. This suggests strong institutional interest around this price level.
2. Order Book Imbalances
Imbalances in the order book can tip you off to potential moves. If there are many more buy orders than sell orders, it indicates bullish sentiment.
Example: In the order book for Tesla (TSLA), you see 20,000 shares at $700 on the buy side and only 5,000 shares at $705 on the sell side. This imbalance suggests a potential upward move.
3. Speed of Tape
The speed at which trades occur can signal momentum or the lack thereof. Rapid trades can mean significant interest or impending news.
Example: You’re watching NVIDIA (NVDA), and suddenly the tape speeds up with trades every second at $400. This rapid activity could precede a breakout or significant news release.
Lesser-Known Tape Patterns
1. Iceberg Orders
Iceberg orders are large orders divided into smaller lots to disguise the total size. When you see small, repeated orders at the same price, you might be looking at an iceberg.
Example: You’re watching Microsoft (MSFT) and notice repeated small buy orders of 500 shares at $280. This could be a large institutional player using an iceberg order to avoid moving the market.
2. Absorption
Absorption occurs when a large number of orders at a specific price level get filled without the price moving significantly. This can indicate strong support or resistance.
Example: While trading Alphabet (GOOGL), you see 50,000 shares being sold at $2,500, but the price doesn’t drop. This indicates buyers are absorbing the sell orders, suggesting strong support at this level.
3. Tape Speed Changes
Changes in the speed of tape can indicate upcoming volatility. If the tape suddenly speeds up after a period of slow trading, it might be the precursor to a breakout.
Example: You’re monitoring Amazon (AMZN), and after a slow trading morning, the tape suddenly speeds up with frequent trades at $3,350. This could indicate an imminent price move.
Practical Example: Tape Reading in Action
Let’s walk through a trading session with a focus on Amazon (AMZN):
1. Pre-Market Analysis
Check the order book and volume before the market opens. If Amazon has large buy orders at $3,300 in pre-market, that sets a bullish tone.
2. Market Open
At the open, the tape moves quickly. You notice Amazon’s stock price jumps to $3,320 with high volume (500,000 shares in the first minute). This strong opening suggests bullish sentiment.
3. Morning Session
Watch the tape for large orders and volume patterns. If Amazon consistently shows large buy orders (e.g., 20,000 shares at $3,310) and the price gradually moves up, it indicates strong buying interest.
4. Midday Observation
The market typically slows down midday. If Amazon still shows steady buy orders at $3,330 and the tape isn’t sluggish, it signals sustained interest.
5. Afternoon Session
Volume picks up again as traders position for the close. If Amazon shows rapid trades with large buy orders at $3,350, it indicates a strong close and potential for continued upward movement.
Numbers and Mechanics: Putting It All Together
Consider this real-time scenario with Amazon:
- Price: $3,300
- Volume: 1,000,000 shares traded in the first hour
- Order Flow: 70% buy orders, 30% sell orders
- Large Orders: Multiple buy orders of 10,000 shares at $3,310
Here’s what we interpret:
- High volume with a predominant buy-side indicates strong bullish sentiment.
- Large orders at slightly higher prices show institutional interest.
- The tight spread ($3,300 bid, $3,301 ask) reflects high liquidity and minimal friction.
Digital Tape Reading: The Algorithmic Frontier
In today’s fast-paced markets, tape reading has gone digital. Algorithms now analyze the tape with lightning speed, providing traders with real-time insights that manual analysis simply can’t match.
Key Algorithms for Digital Tape Reading
-
VWAP (Volume Weighted Average Price) VWAP calculates the average price a security has traded at throughout the day, based on both volume and price. It helps identify whether a stock is trading below or above its average price, indicating potential buy or sell opportunities. Example: If Netflix (NFLX) is trading at $500, and the VWAP is $495, it indicates the stock is trading above its average price, suggesting buying pressure.
-
Time-Weighted Average Price (TWAP) TWAP averages out the price of a security over a specific time period. It’s useful for executing large orders without significantly impacting the market.
Example: A fund wants to buy 100,000 shares of Facebook (FB) without causing a price spike. Using TWAP, they can spread the order over several hours or days, executing trades at various times to minimize market impact.
- Order Flow Analysis Algorithms These algorithms analyze the order book and time and sales data to detect patterns such as order imbalances, iceberg orders, and absorption.
Example: You’re trading Google (GOOGL), and the algorithm detects repeated small orders at $2,800, suggesting an iceberg order. It also spots a significant imbalance with more buy orders than sell orders, indicating potential upward movement.
Platforms for Digital Tape Reading
- Bookmap: Advanced trading platform that provides real-time order book visualization and heatmap analytics, allowing traders to gain deeper insights into market liquidity and order flow dynamics.
- Quantower: Provides advanced order flow analysis, quantitative trading tools, and multi-broker support, catering to algorithmic and discretionary traders.
- MotiveWave: Offering order flow analytics, and integrated strategy backtesting.
Final Thoughts
Tape reading is a mix of art and science. It’s about interpreting the numbers and the behavior behind them. By honing this skill and leveraging modern algorithms, you can gain an edge in anticipating market moves. Remember, every tick on the tape tells a story—listen carefully, and you might just hear the market whispering its secrets. So, get your feet wet, and don’t be shy—like a friendly neighbor, the market’s always got something to say if you know how to listen.