


Overview
Key Features
- User-configurable volume-weighing algorithm
- Low-lag to leading RSI slope
- Custom source input for advanced analysis and custom strategies
- Free, available for TradingView, a free platform – yes, we believe in democratizing trading and levelling the playing field
Input Parameters
- Length – controls the averaging length of the RSI line.
- P/V Weighing – a price/ volume smoothing filter, with higher values yielding a smoother RSI line. Values over 10 can introduce lag but also help identify trend. We thought 5 was a pretty good momentum gauge (strengthening, weakening)
- P/V Source – this variable is where you can get creative and blend volume with either direct price action (close, H+L/2, etc.) or other indicators such as moving averages, stochastic oscillator, and even the vanilla RSI.
- Upper Limit – the NEXT RSI level above which market is considered overvalued, default is 75
- Base Bias – the NEXT RSI level above which market bias is considered bullish, and below bearish
- Lower Limit – the NEXT RSI level below which market is considered undervalued, default is 25
Strategies
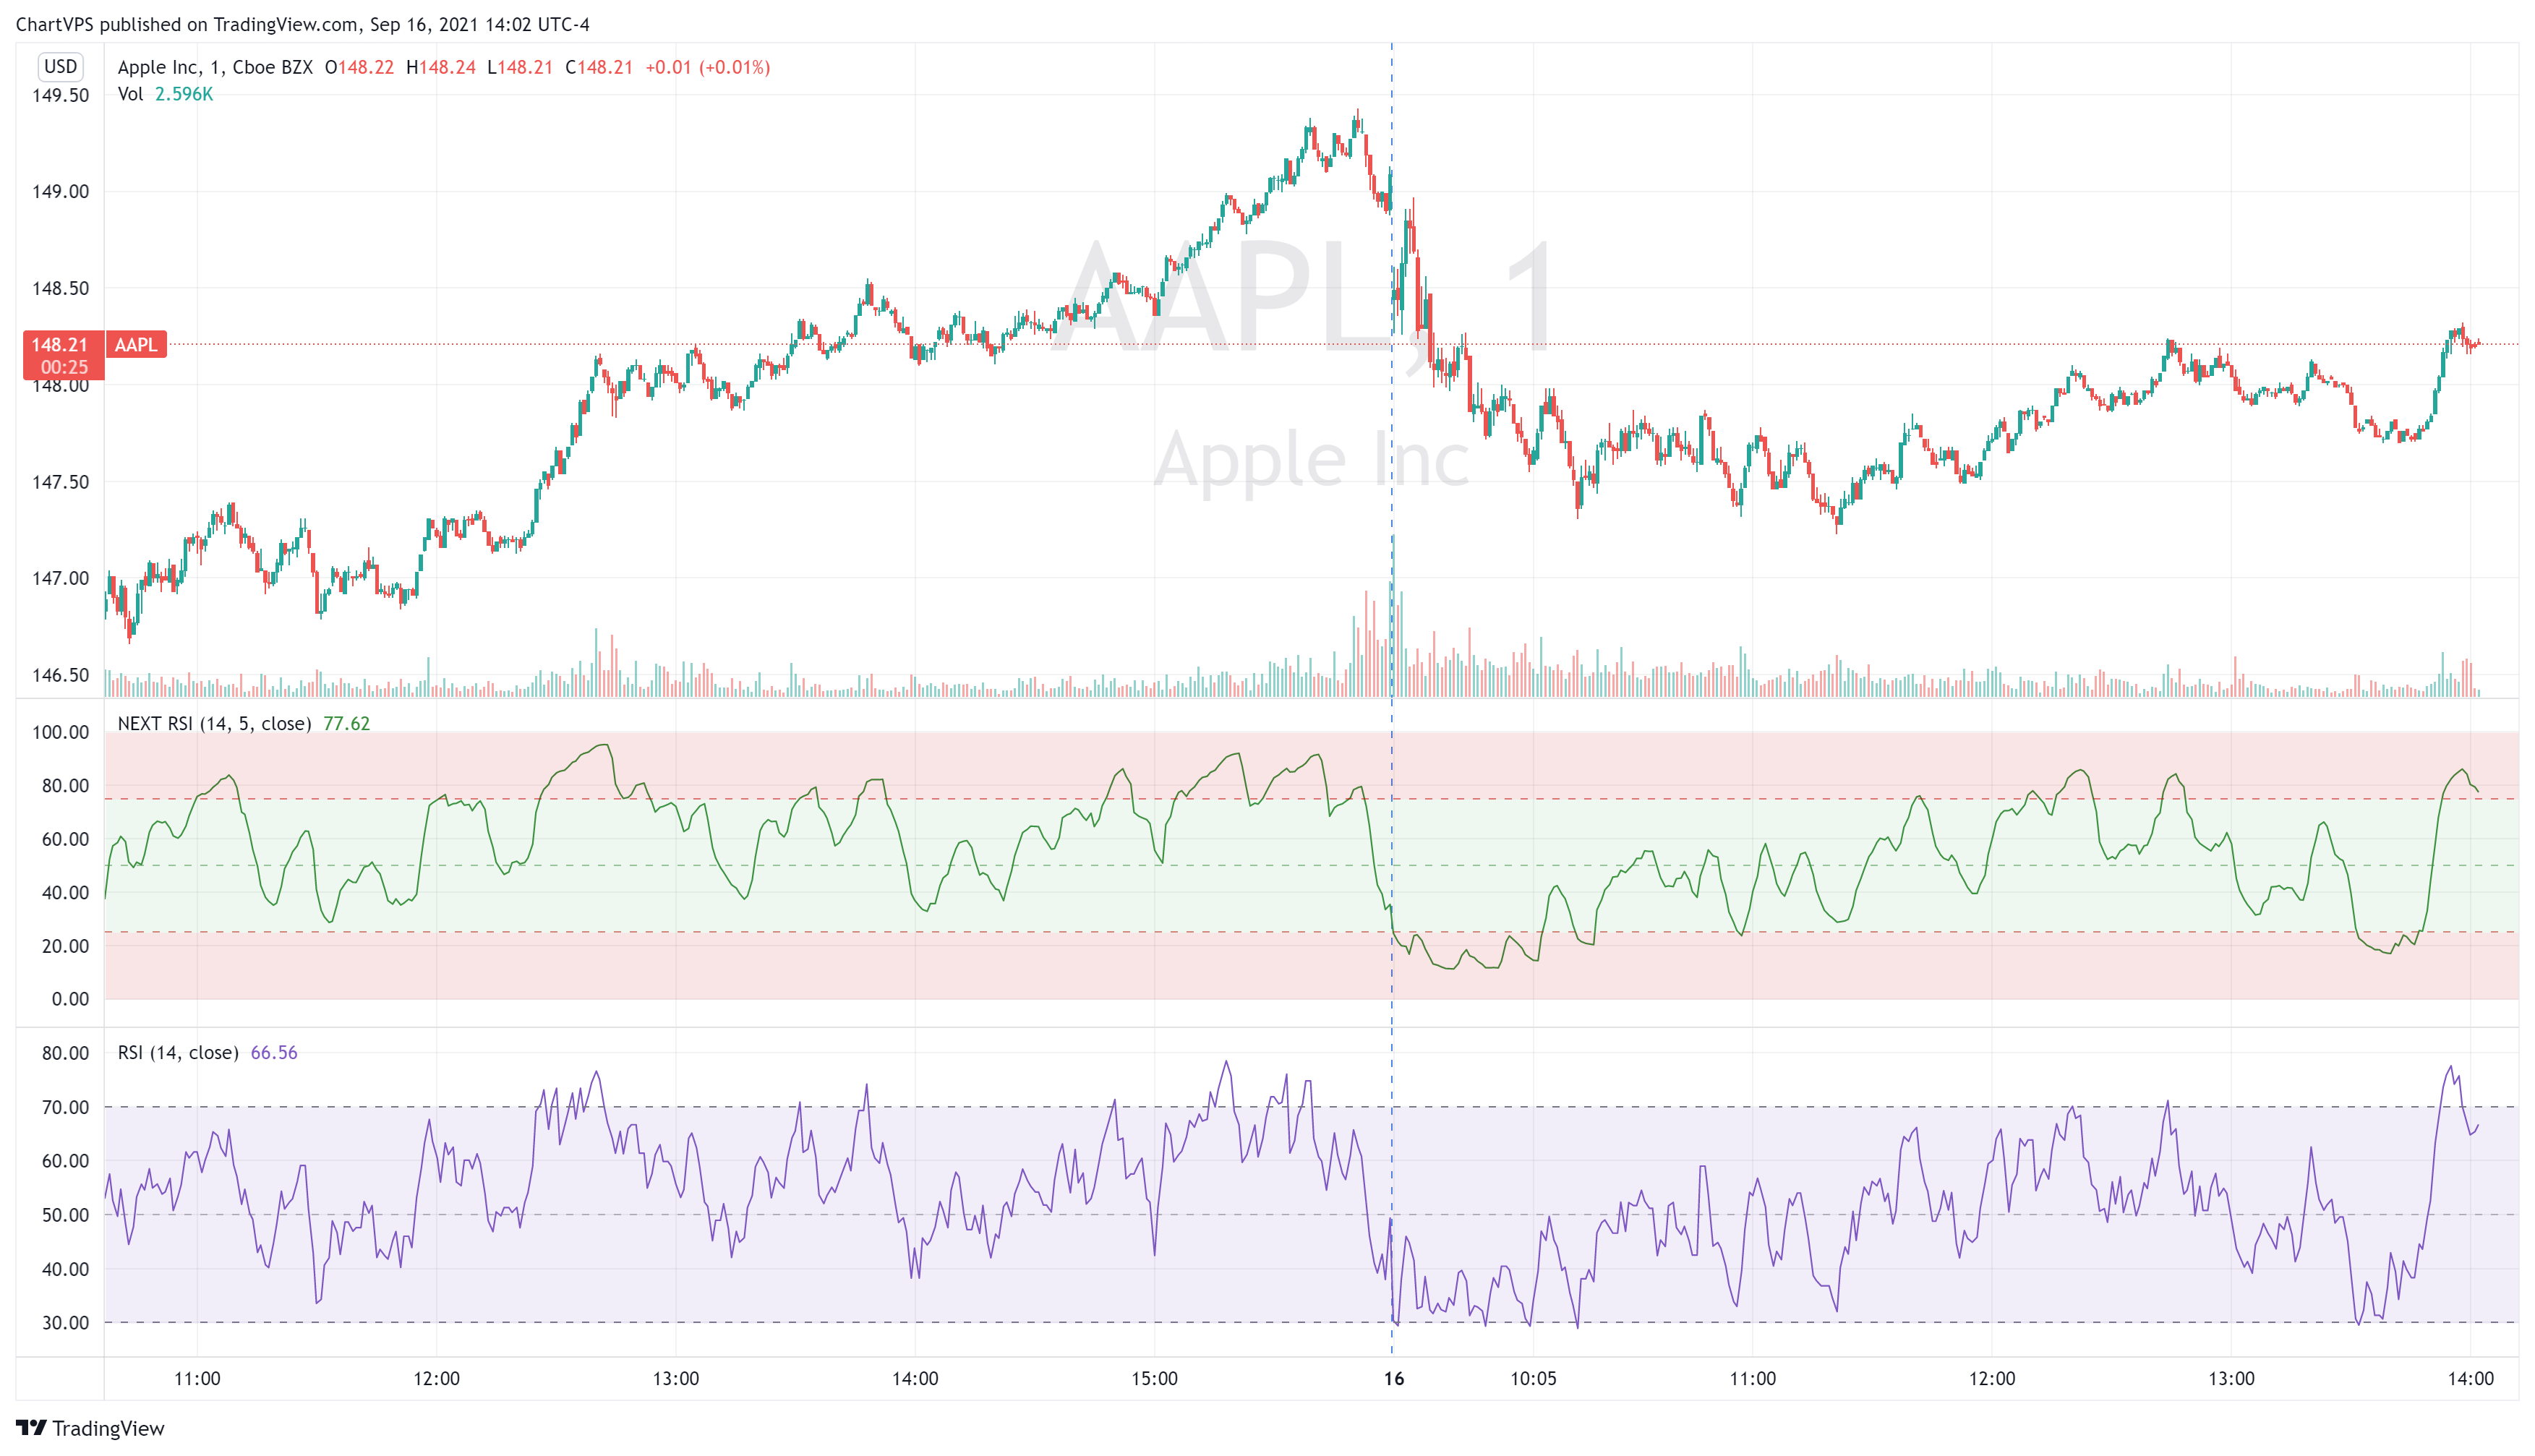
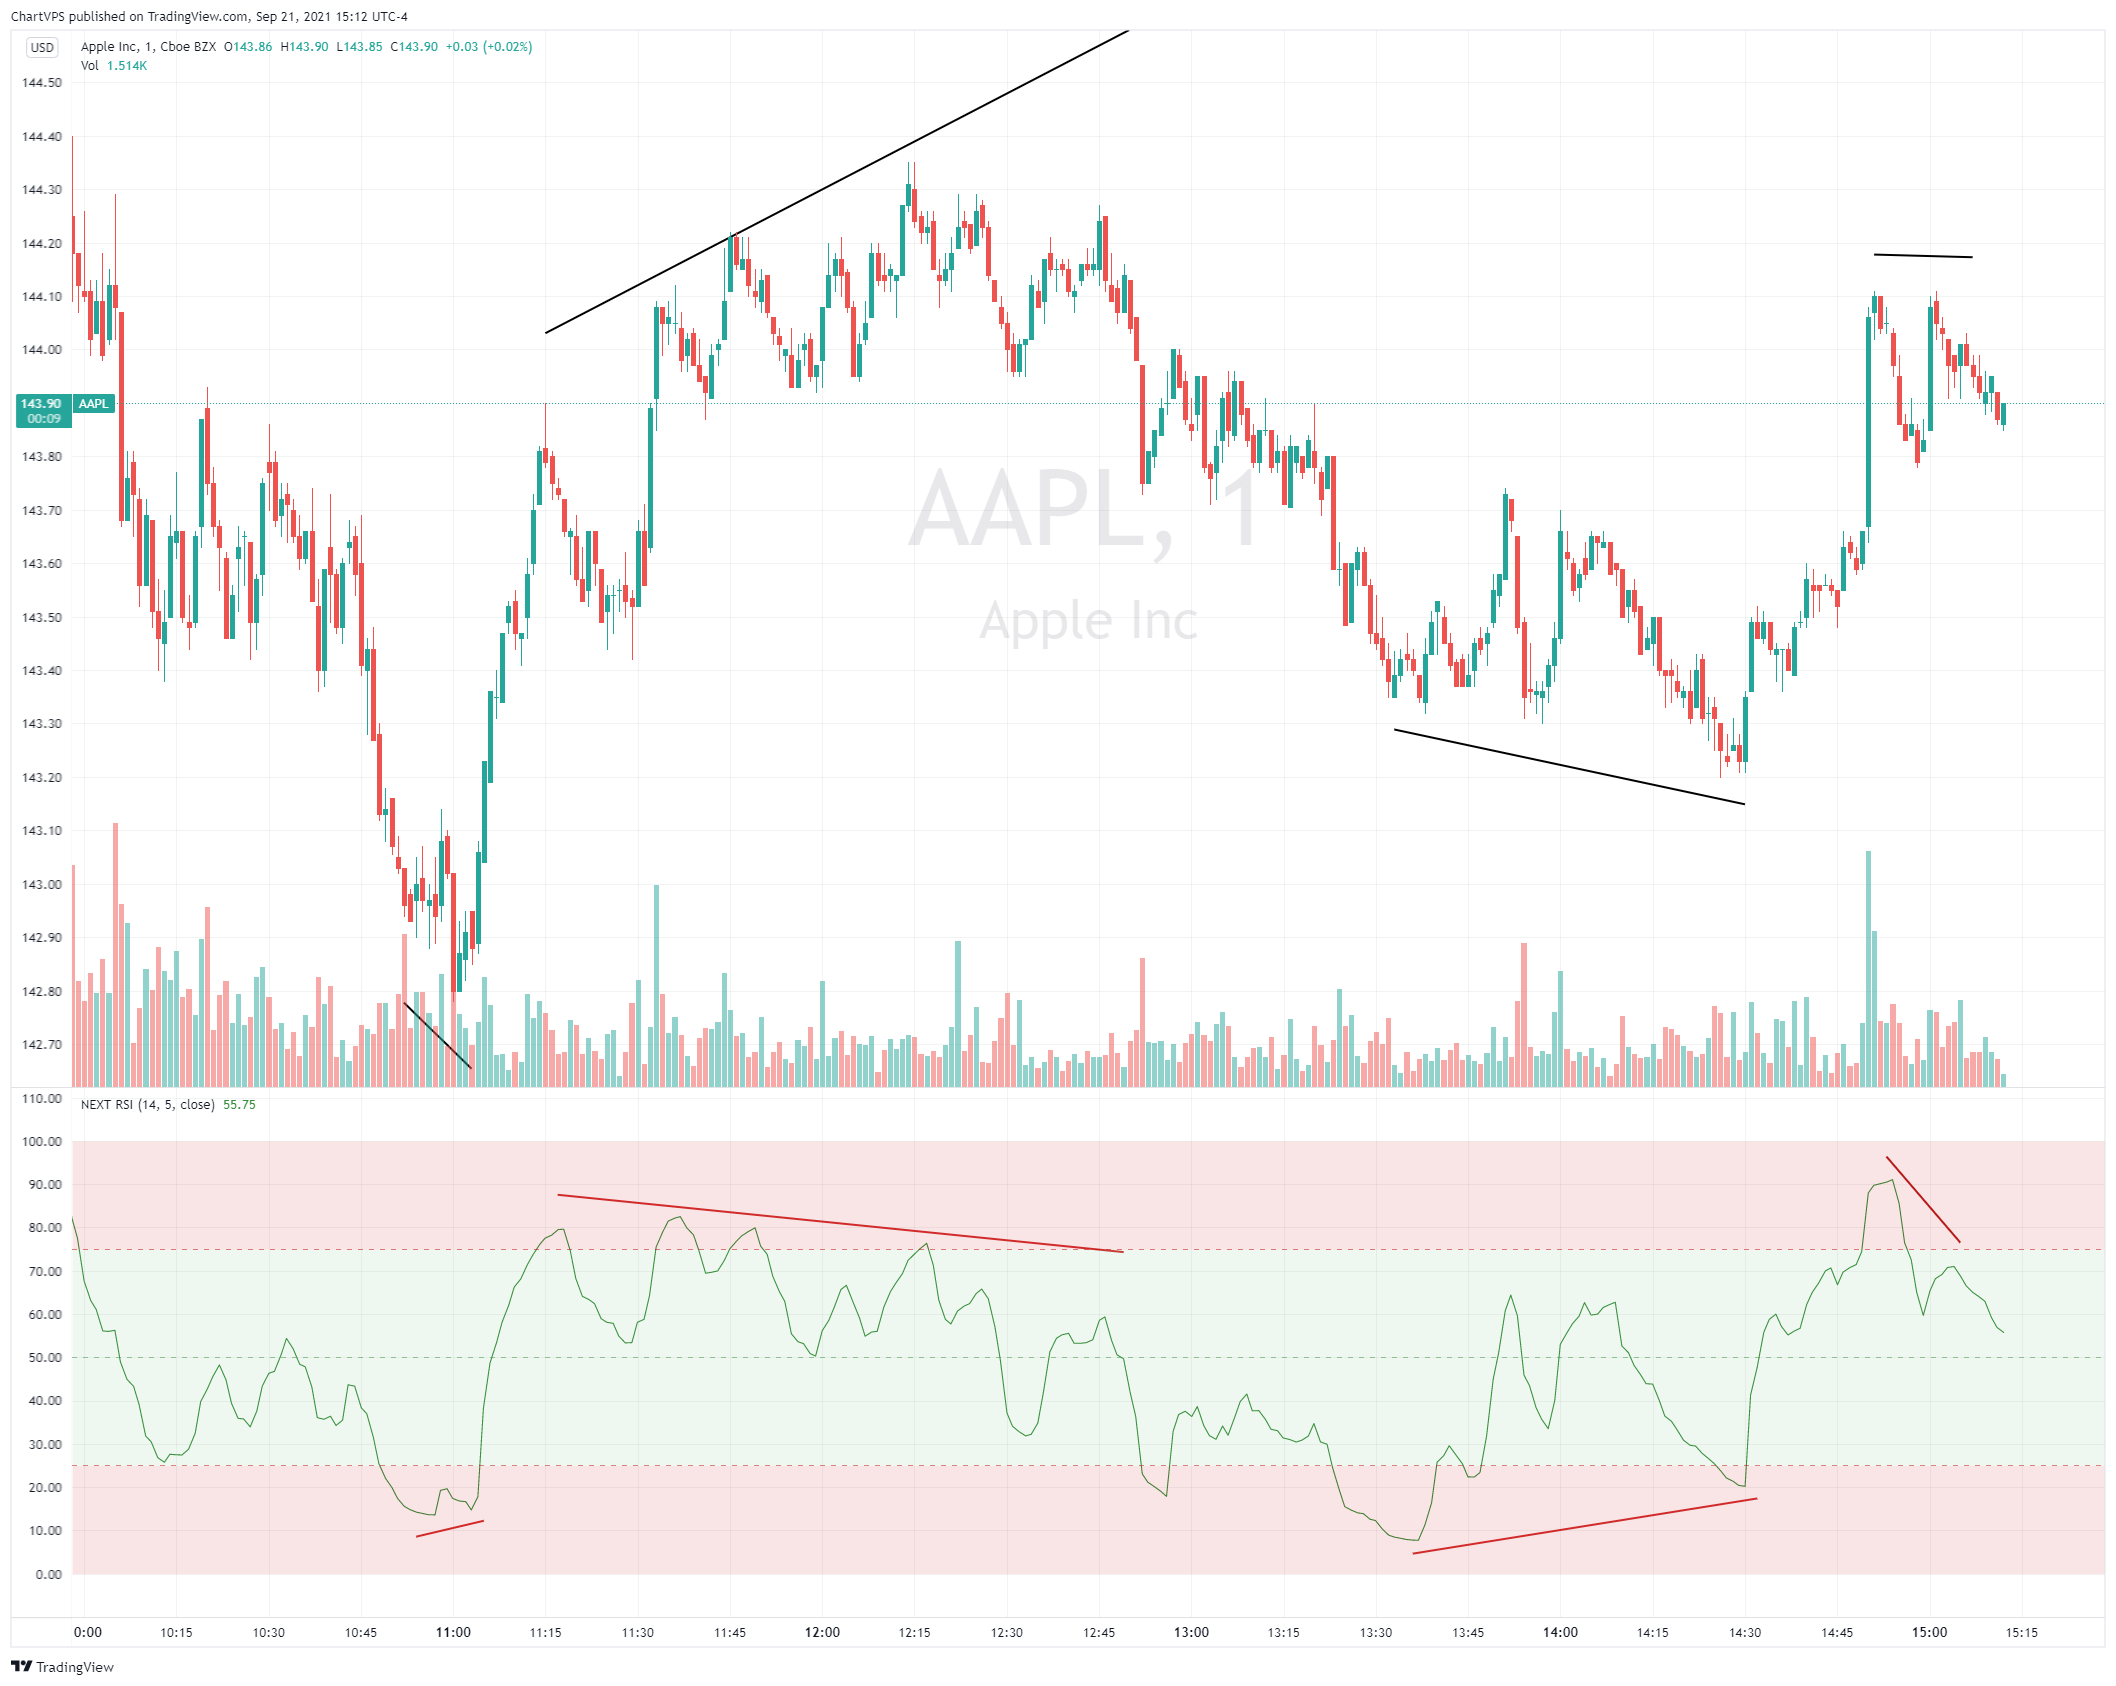
Valuation, Bias, and Divergence Play
NEXT RSI is intended to be used just like the vanilla RSI within the context of technical analysis: identifying overvalued (above upper limit) and undervalued (below lower limit) price action, as well as establishing a bias baseline ( bullish if over 50; bearish if under 50). Higher NEXT RSI bottoms compared to lower price bottoms signify bullish divergence ; lower NEXT RSI tops compared to higher price tops signify bearish divergence. The screenshot below shows NEXT RSI intraday divergence plays on AAPL M1 price action.
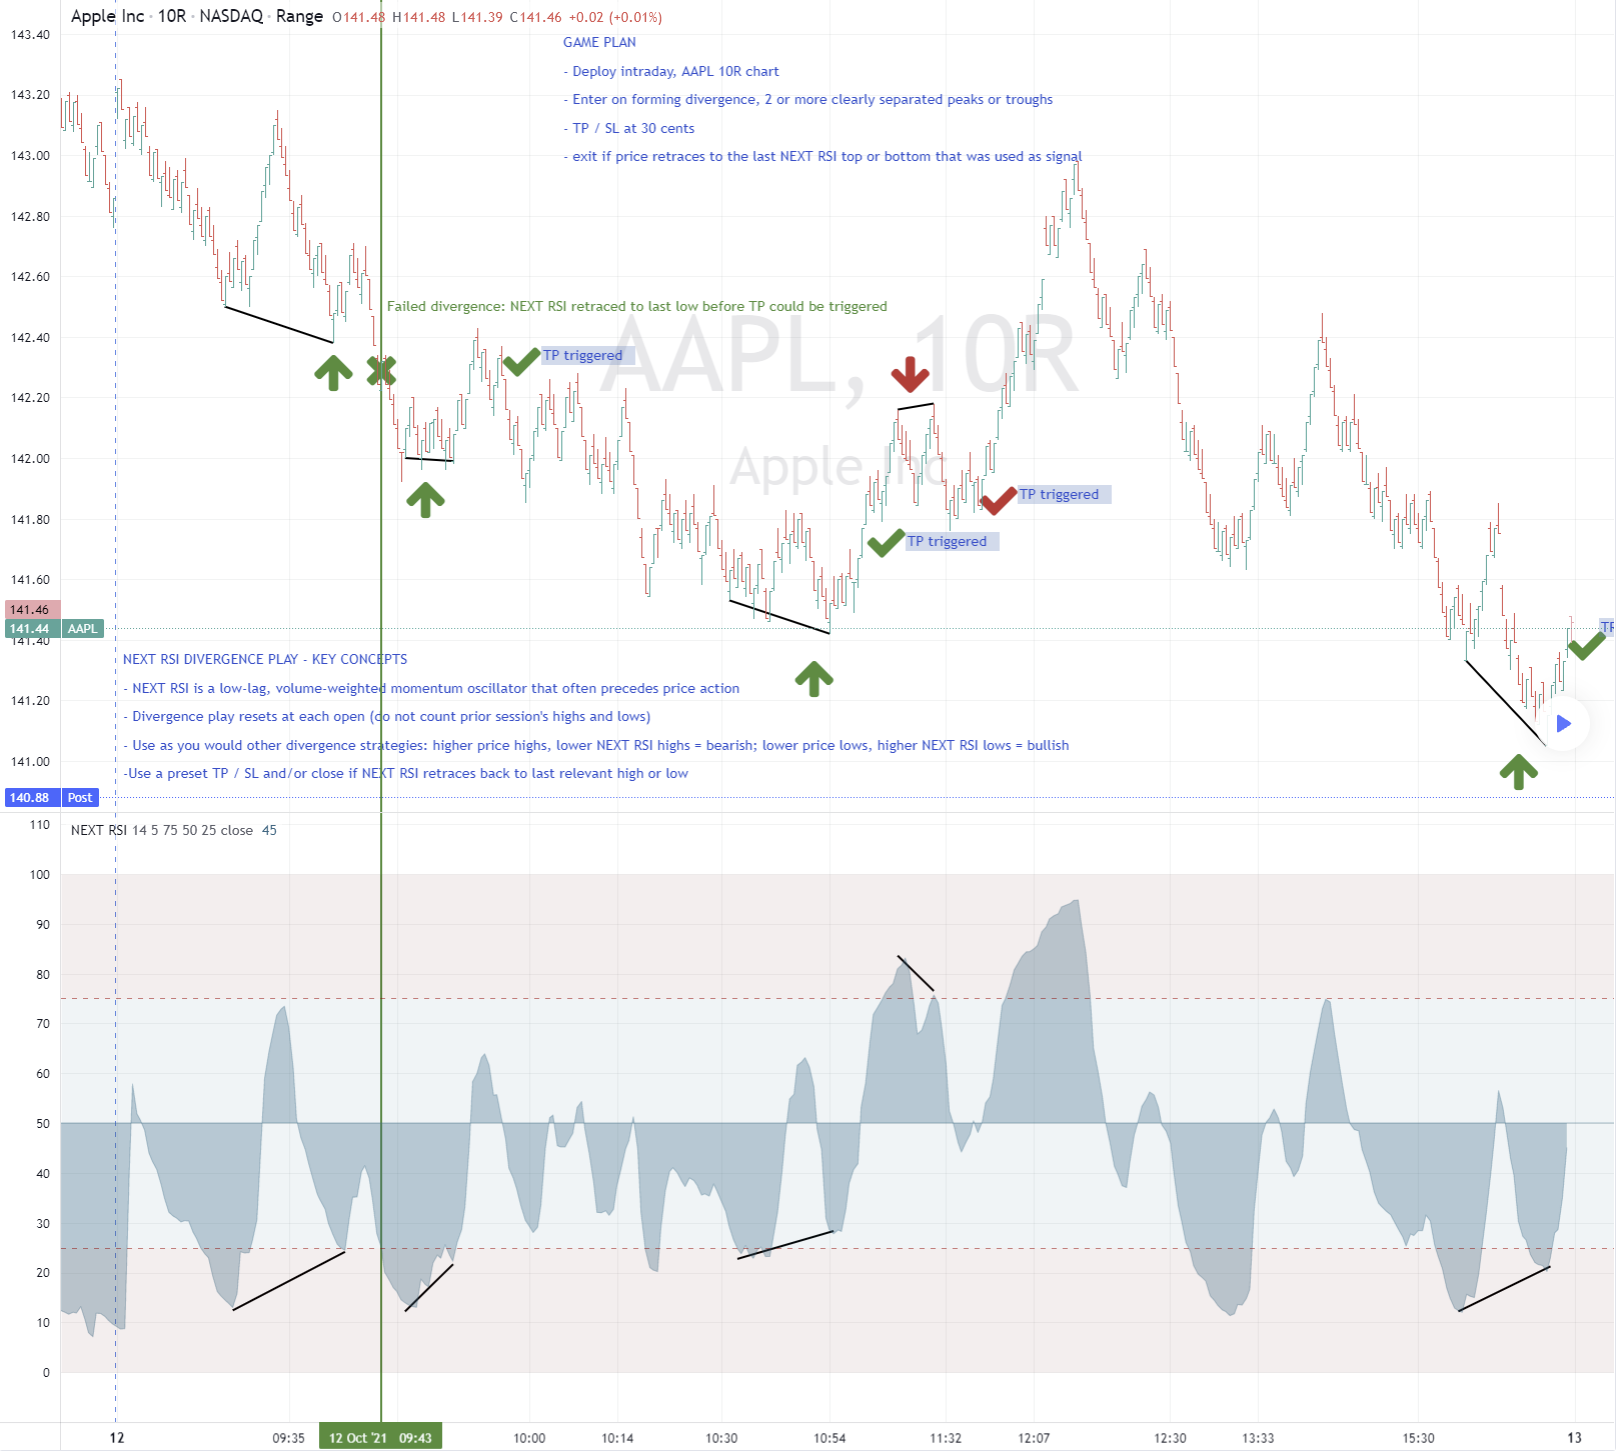
Divergence Play on AAPL 10-Range Chart
Below, we have another AAPL divergence play, this time with a full strategy game plan, commentary, and order management rules.
You can find the high-resolution, interactive version of the above chart on our TradingView Ideas page.
NEXT RSI Divergence Play: Key Concepts:
- NEXT RSI is a low-lag, volume-weighted momentum oscillator that often precedes price action
- Divergence play resets at each open (do not count prior session’s highs and lows)
- Use as you would other divergence strategies: higher price highs, lower NEXT RSI highs = bearish; lower price lows, higher NEXT RSI lows = bullish
- Use a preset TP / SL and/or close if NEXT RSI retraces back to last relevant high or low
Order Management:
- Enter on forming divergence, 2 or more clearly separated peaks or troughs
- TP / SL at 30 cents
- Exit if price retraces to the last NEXT RSI top or bottom referenced when opening the position
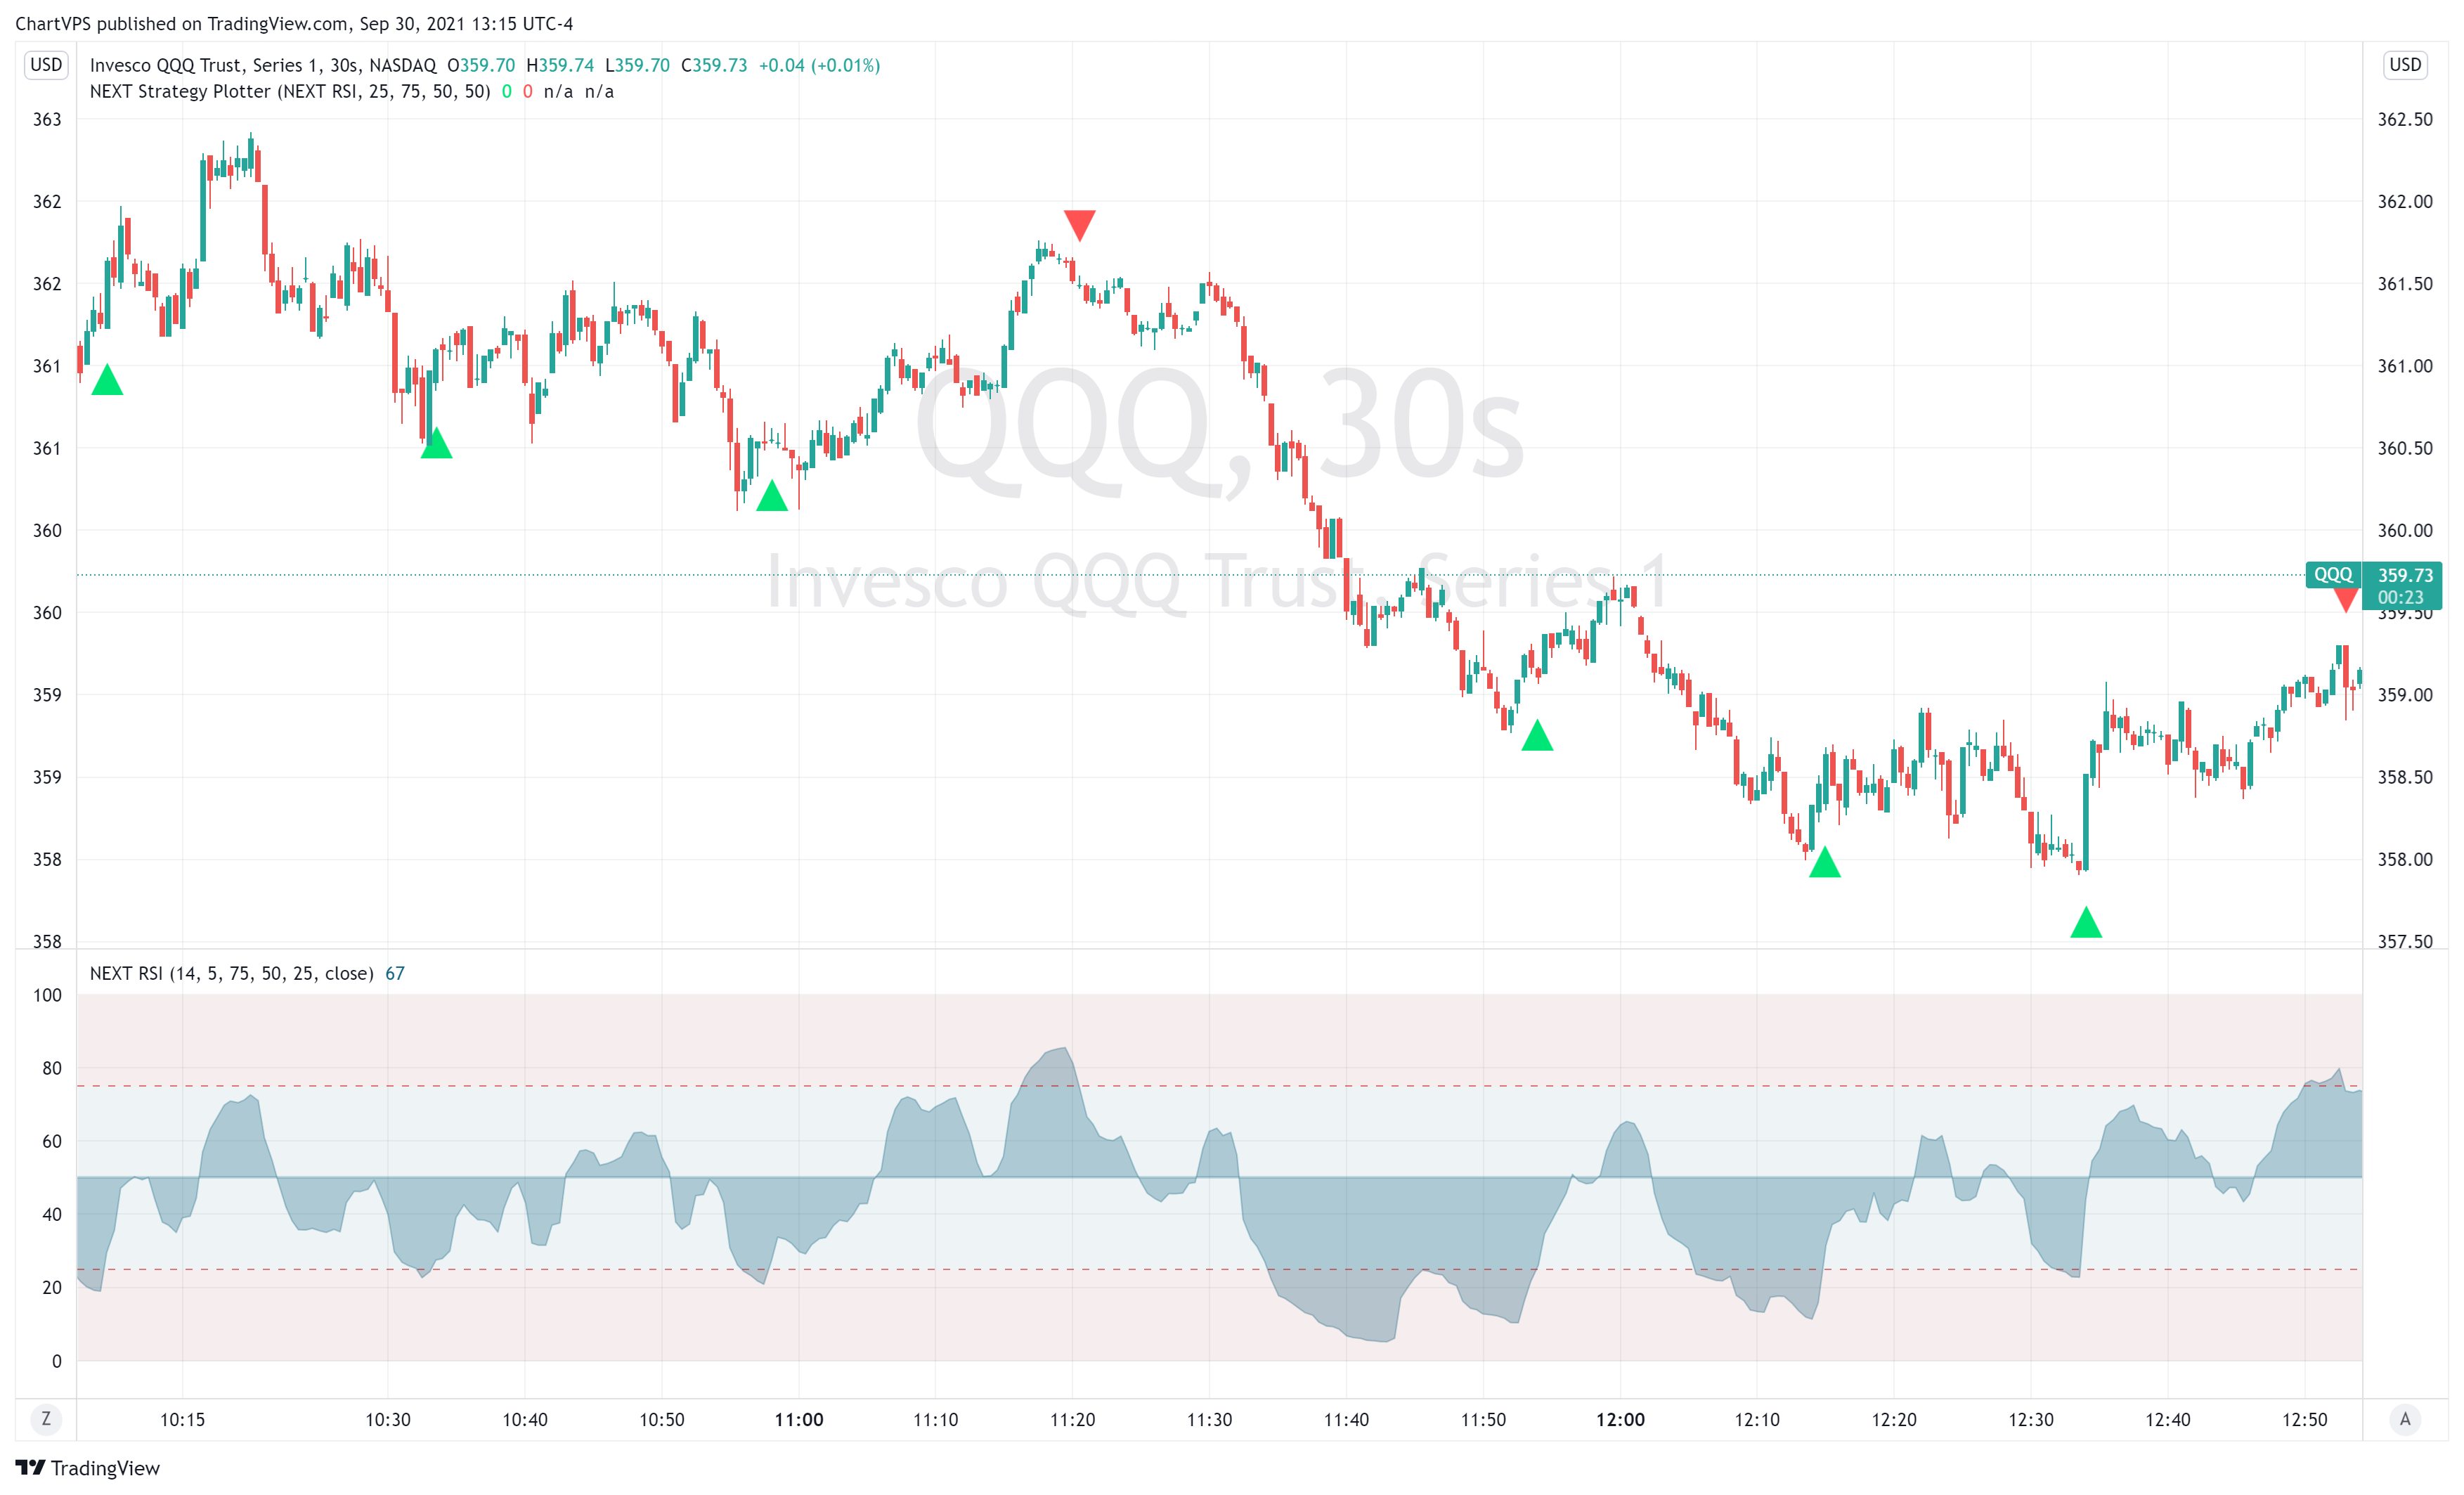
Trading Overbought/Oversold Levels
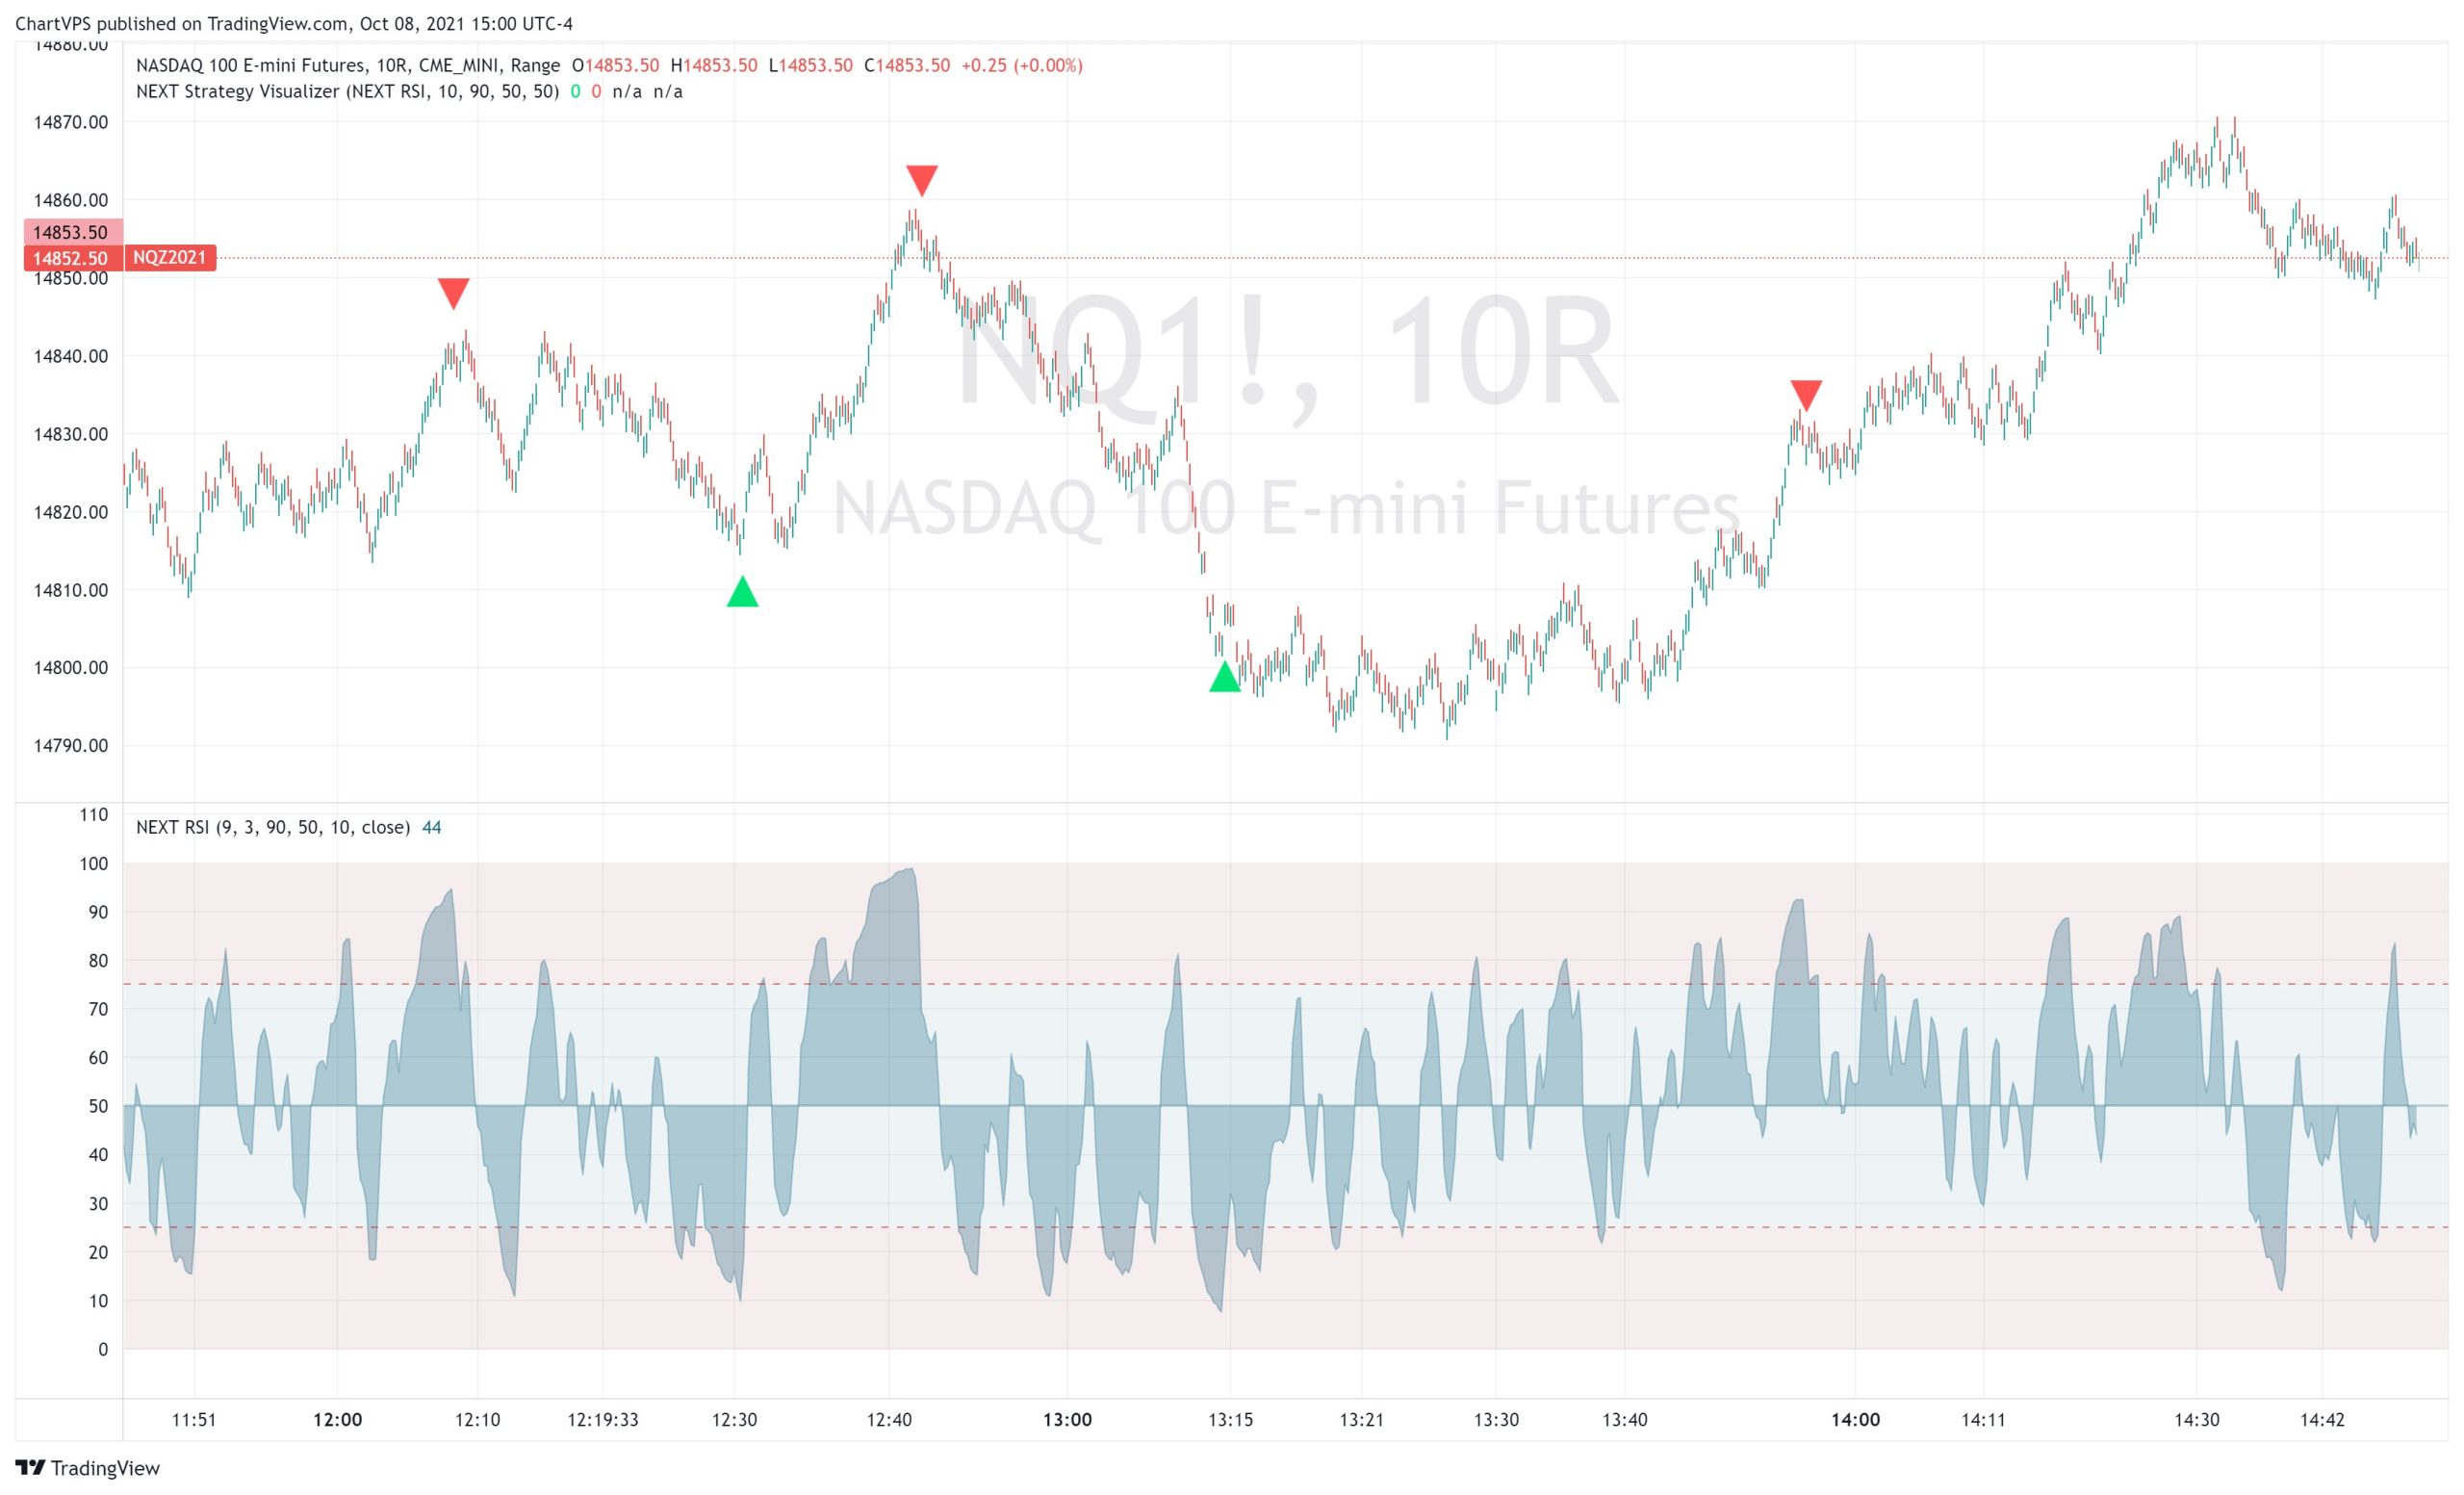
Similar to other momentum oscillators, NEXT RSI can be used as an aid to trade momentum – going short when RSI enters overvalued territory (typically 70), going long when it enters undervalued territory (typically 30). The example above is a NEXT RSI momentum play strategy – short when RSI crosses under 75 (overvalued level); long when it crosses over 25 (undervalued level). NEXT RSI is set to 9,3. Plotting of signals is achieved via NEXT RSI’s companion add-on: NEXT Strategy Visualizer.
Download
TradingView is our platform of choice for publication of the NEXT framework (indicators, strategies, etc.). The platform is free to use (Basic plan) with optional paid features, if you need them. You don’t for NEXT when using a single chart. Their fair approach to empowering retail traders aligns with ours. Trading should not be exclusive to hedge fund managers and professional traders. You can find all of our algo-driven software on the ChartVPS TradingView Scripts page. If you do decide to go with a paid version of TradingView (not required for ChartVPS NEXT), you can use this link to get up to $30 off.
