In a nutshell
Our latest trading room - AAPL L15 - takes lower-risk, long-only positions in Apple Inc's stock. It is based on the new L-Class algorithm whose valuation incorporates price-volume patterns and market breadth.
Active Algo: AAPL L15
Signal Channel: Discord >> #aapl-l15
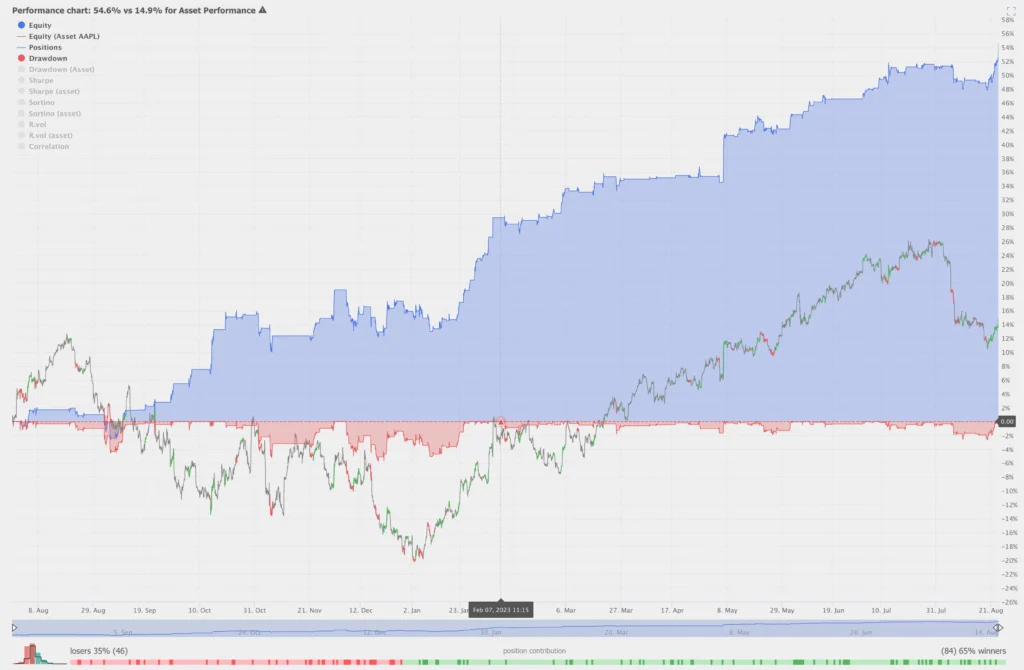
Description: AAPL L15 is ChartVPS NEXT’s latest trading room, based on the new L-class of algorithms we’ve been researching and testing these last several months. L-class is purely focused on long (positive price) action with 2 objectives in mind: minimizing equity curve (ROI) volatility and preserving capital during bouts of bearish activity. If you look at the equity curve attached, you can see that while the Apple Inc. (AAPL) stock experienced significant drawdowns and volatility over the last 13 months, AAPL L15 was relatively flat and even gained a little. During bullish periods, L15 fully participated and capitalized on positive price action.
The L-class algo takes advantage of 2 main areas of analysis: price-volume patterns and market internals (breadth). With max drawdown of 6%, positive Sortino Ratio (return on investment exceeds volatility risk), and a beta of only 0.19 it is uncorrelated with the AAPL stock, unless the stock is gaining, which makes it suitable for more conservative, balanced portfolios. With fewer, slower moving trades (<20 a month, average trade lasting ~3.5hours), L-class is well-suited for less active investors looking to participate in the market without thinking about it too much.
Stats
Algo Family: Anabasis (L-Class)
Algo ID: AAPL L15, Gen1
Market NASDAQ: AAPL (Apple Inc. stock)
Data Analyzed 13 months
Net Perf, all 54.6%
Asset Perf. 14.9%
Beta (vs Asset) 0.19
Correlation (vs Asset) 0.38
Positions 130
Wins 65%
Losses 35%
Max DD -5.7%
Max DD (Asset) -29.2%
Average Win 0.89%
Average Loss -0.65%
Average Return 0.34%
Rew/Risk Ratio 1.36
Expectancy 0.5
Exposure 27.1%
Avg. Length 13.6
Return St.dev 1.2
Loss St.dev 0.7
Win St.dev 1.1
Sharpe 3.31
Sharpe (Asset) 1.10
Sortino 1.24
Sortino (Asset) 1.58
Win Streak, max 12
Win Streak, avg 2.8
Loss Streak, max 4
Loss Streak, avg 1.5
Net Perf, 1mo 3.6%
Net Perf, 3mo 12.3%
Net Perf, 6mo 25.1%
Net Perf, 1y 53.7%
Trades/Month 19.9
Trades/Day 0.7
R. vol 12.62%
R. vol (Asset) 27.64%

