


Volume Profile and Nodes of All Volumes
We’ve taken a gander at other volume-based tools and indicators, like VWAP and AVWAP, as well as briefly discussed things like On-Balance Volume and Accumulation/Distribution. Now, we’ve reached a different volume-based tool – Volume Profile. Though it’s just as useful as previously workshopped ideas, it stands out for a few reasons. Before we get to all that, though, we’ve gotta figure out what volume profile is.
What is Volume Profile?
A volume profile is less focused on the “when” of trades and more focused on the “where.” So while your more regular volume indicators are all about how much was traded and when, a volume profile shows you exactly where a security was traded. This makes for a decidedly more horizontal bar chart vibe, with each bar’s length showing what the volume was at each price.
I mentioned two of the key components of a volume profile in the introduction: high-volume and low-volume nodes. Let’s get a move on and give them a look next!
What is a High-Volume Node?
So to start, a high-volume node is essentially a peak on a volume profile’s bar chart. It shows a place where lots of trading took place, signifying fair value due to all the buyers and sellers who were down to trade at that spot.
What is a Low-Volume Node?
By that logic, you’ve probably concluded that a low-volume node is the opposite of a high-volume one. While a high-volume node is a peak, a low-volume node is a valley. It shows a spot where not much trading took place, making for an area of unfair value, which were more or less passed up by the price.
Other Important Aspects of Volume Profiles
I say we start with the point of control. This is the solitary point in the whole profile with the absolute highest traded volume. It’s the biggest and most important high-volume node by a country mile, and it’s typically seen as the most essential and important support or resistance level. The reason for this is that it represents the point within the period in which the highest amount of trading volume happened.
Then there are value areas. These are the range of prices in which around 70% or so of the security’s total trading value happened. It’s an important zone of fair value for whatever period you’re analyzing with it for a few different reasons. Primarily because it shows where the market was feeling good and comfy about doing business, but also because they help to show whether a market is in a phase of acceptance or rejection. How a price acts in relation to value areas can even show whether a trend is going to continue or head towards exhaustion, so to put it simply, value areas help traders figure out the current context of a market.
How to Make a Volume Profile
If you’re looking to create your own, the easiest way to make a volume profile is with trading software. If you use TradingView or MetaTrader, or really any modern trading program, you can get a volume profile indicator and apply it to whichever chart you choose. Note that you do have to at least be on the Essential plan on TradingView to use it, though.
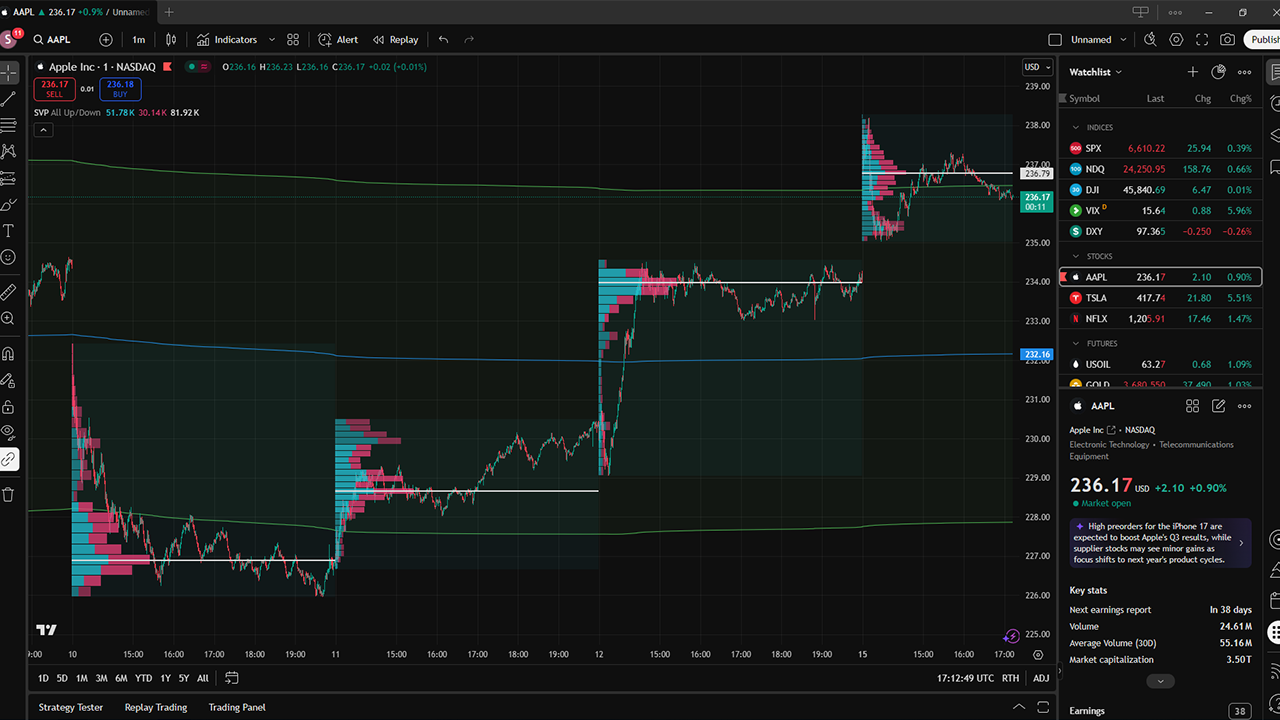
As an example, you can take a look at a Session Volume Profile applied to AAPL in TradingView below:
First, you’d need to define a range – a time period on a chart. Then, you tally up all the ticks on the chart in that period, as well as the price at which each trade happened. With this info, make a histogram, with each bar representing the volume traded at each price. Use this to find the high-volume nodes and the low-volume nodes, which are longer and shorter, respectively.
Finally, it’s time to find the value area. Add up the volume from the point outwards both ways until you hit the predetermined percentage of the period’s total volume (the roughly 70% we mentioned earlier). The prices at the top are called the Value Area High, while the ones at the bottom are called the Value Area Low.
How Do You Use Other Indicators With Volume Profiles?
You could actually use quite a few of the indicators and tools we looked at in conjunction with volume profiles. Here’s how to do so with each of the ones we’ve wrangled with in the Workshop:
VWAP (Volume-Weighted Average Price)
If a security’s price is about both the high-volume node and the VWAP, it likely means there’s abundant buying pressure present. Meanwhile, if the price goes below the two of them, it probably means there’s lots of selling pressure.
OBV (On-Balance Volume)
If the price and OBV were to diverge from one another, it would be a good signal. If the price were going high while the OBV wasn’t, it would indicate that what’s happening isn’t supported by volume, which could go into a reversal. Volume profile could be used to find both support (through high-volume nodes) and resistance (through low-volume nodes) levels, which gives you an idea as to where these reversals might take place.
A/D (Accumulation/Distribution)
Both the price and the A/D line going in one direction make for a nice confirmation. Let’s say a security breaks out above a volume profile’s low-volume node while the A/D line is headed up simultaneously. This tells you that this breakout has a good amount of accumulation behind it, so it has a better chance of keeping the pattern up. Meanwhile, a more wimpy breakout with an A/D line in decline is probably a fake signal.
Conclusion
As you can see, volume profile makes for an excellent foil to things like AWAP and OBV. It can help you see exactly where trades are happening on a security, and it works great with so many other indicators and tools. It seems as though there are always more indicators and tools to get a handle on as you continue to trade, so why not let volume profiles be your next step towards trading excellence. Just…maybe don’t try to calculate them yourself.