


Overview
Trend Delta Moving Average (TDMA) is a composite moving average, driven by an algorithm that tracks real-time trends in price, volume, and various changes (delta) between the two. TDMA is low lagging but filtered (smoothed) MA type, with a sometimes predictive slope (via price divergence). This indicator allows you to plot one or two TDMA lines, as well as their crossovers, expressed in the form of long/short signals.
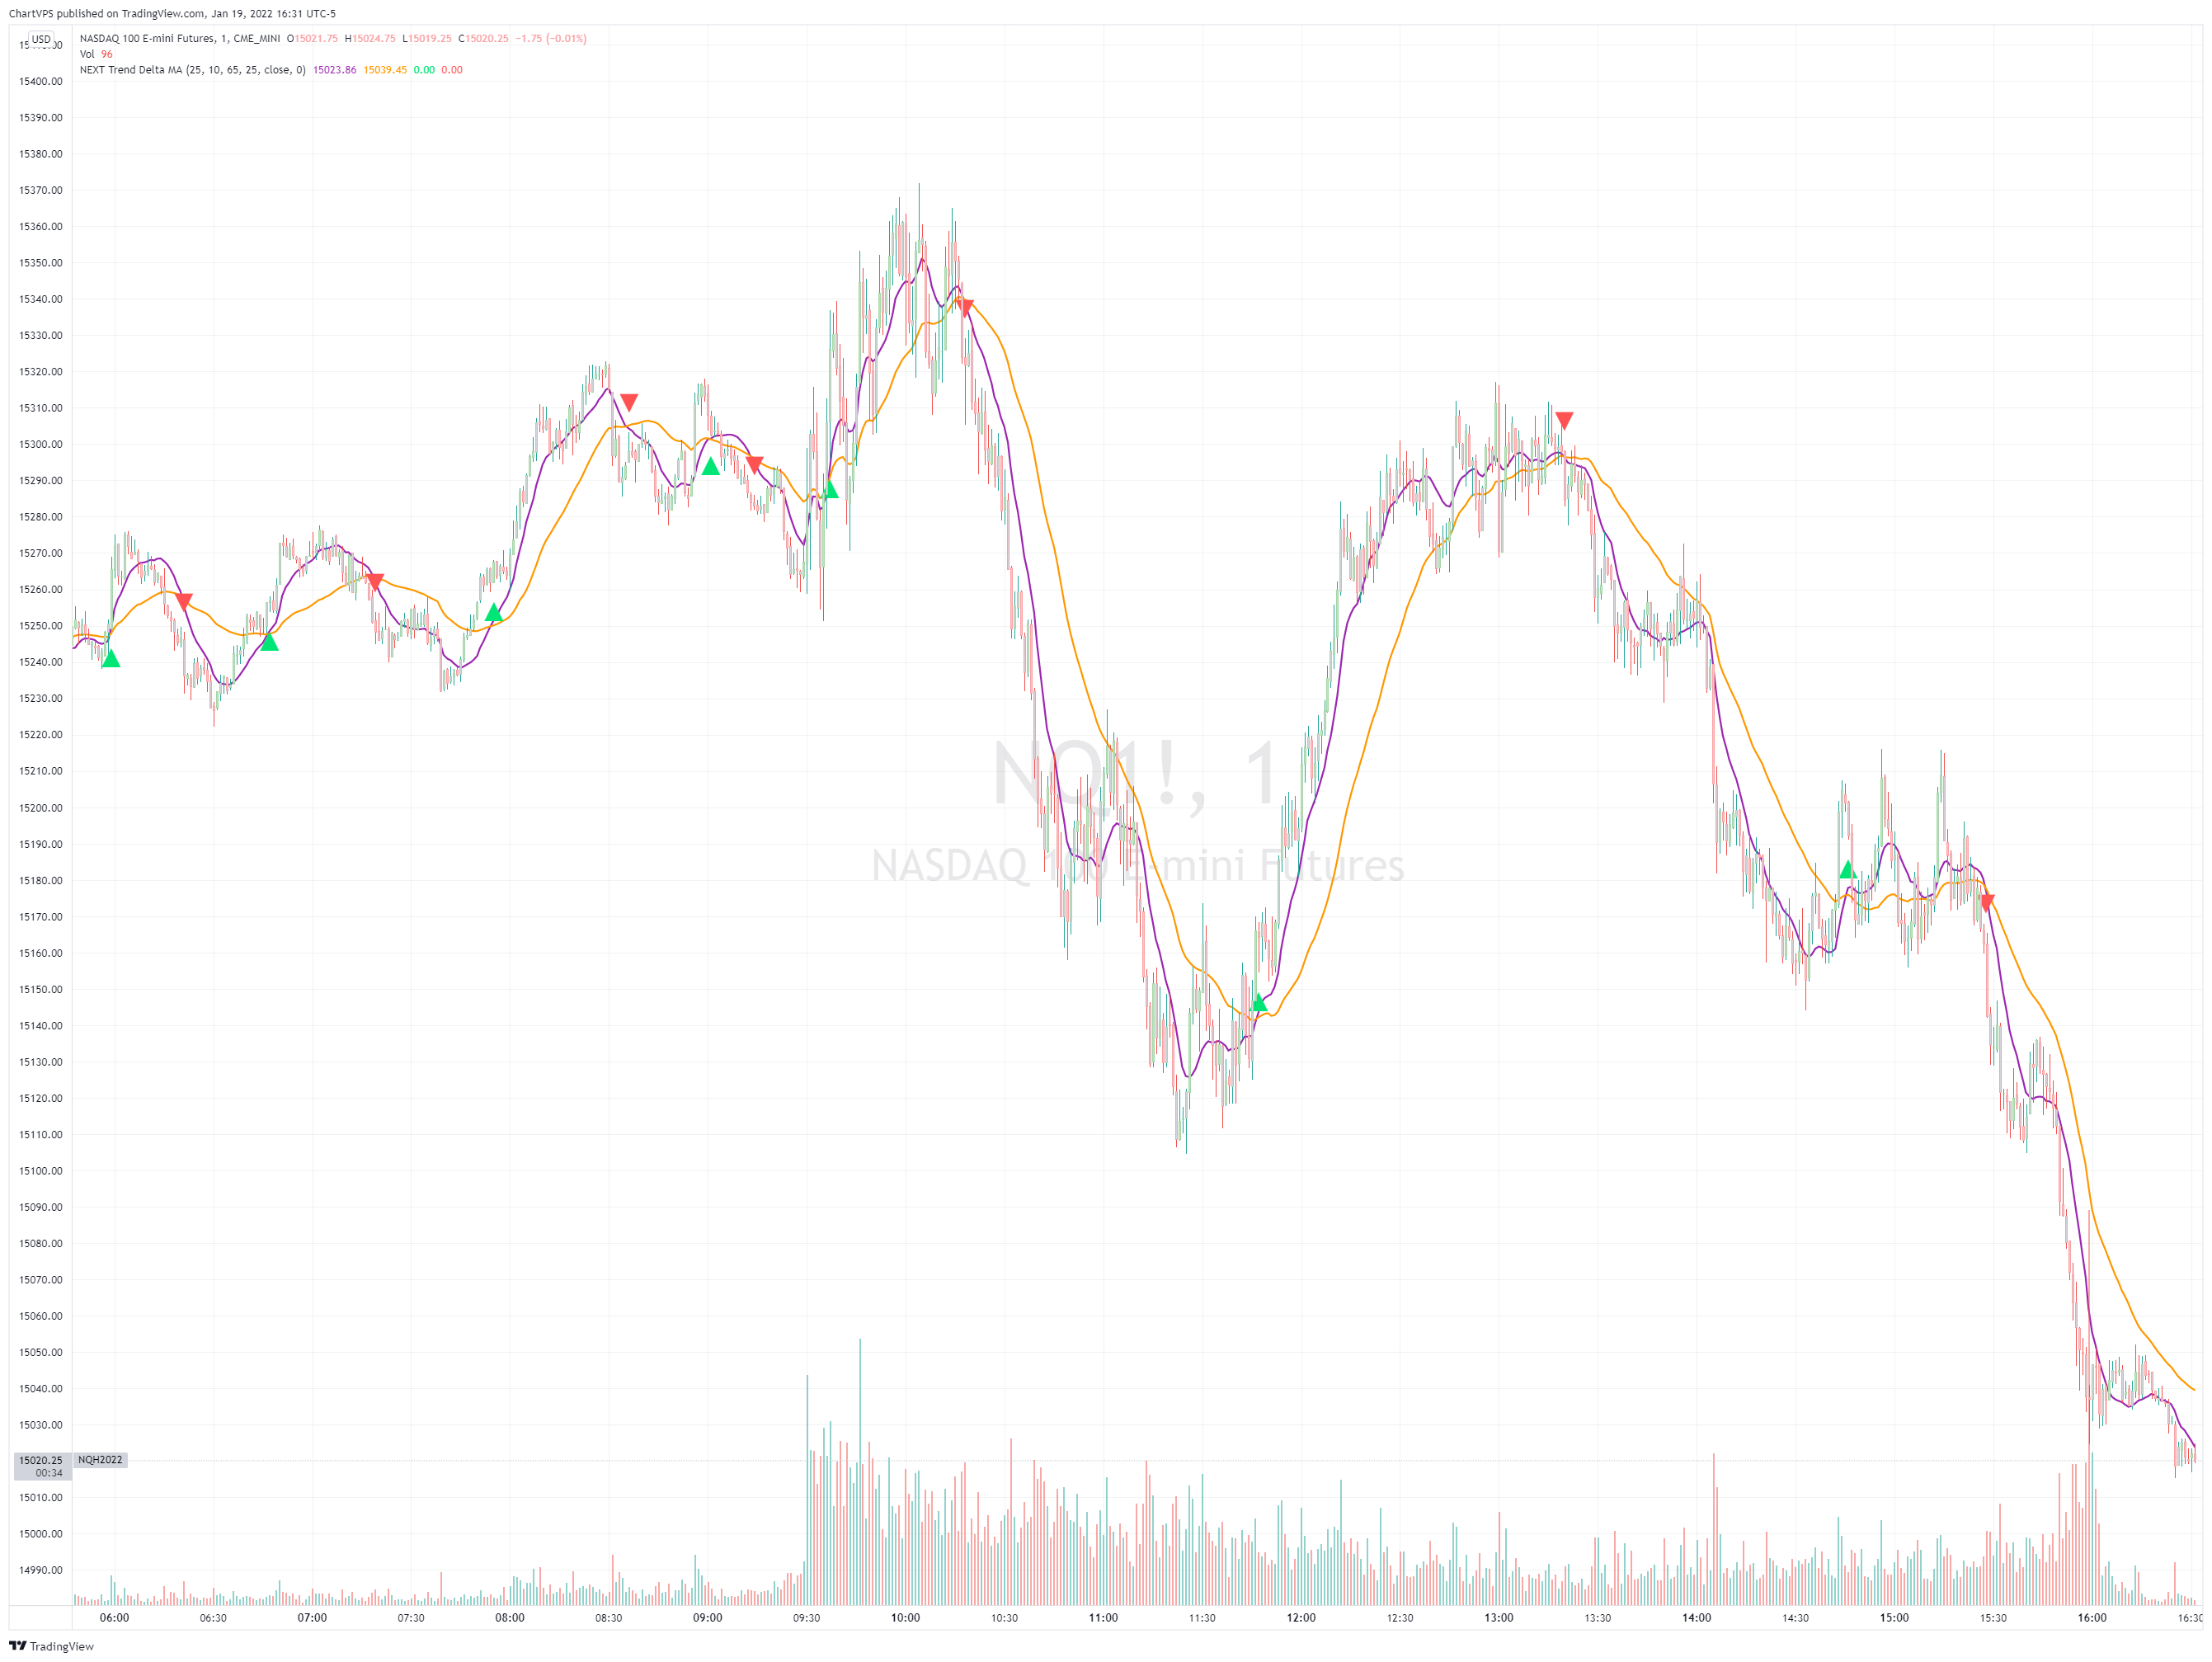
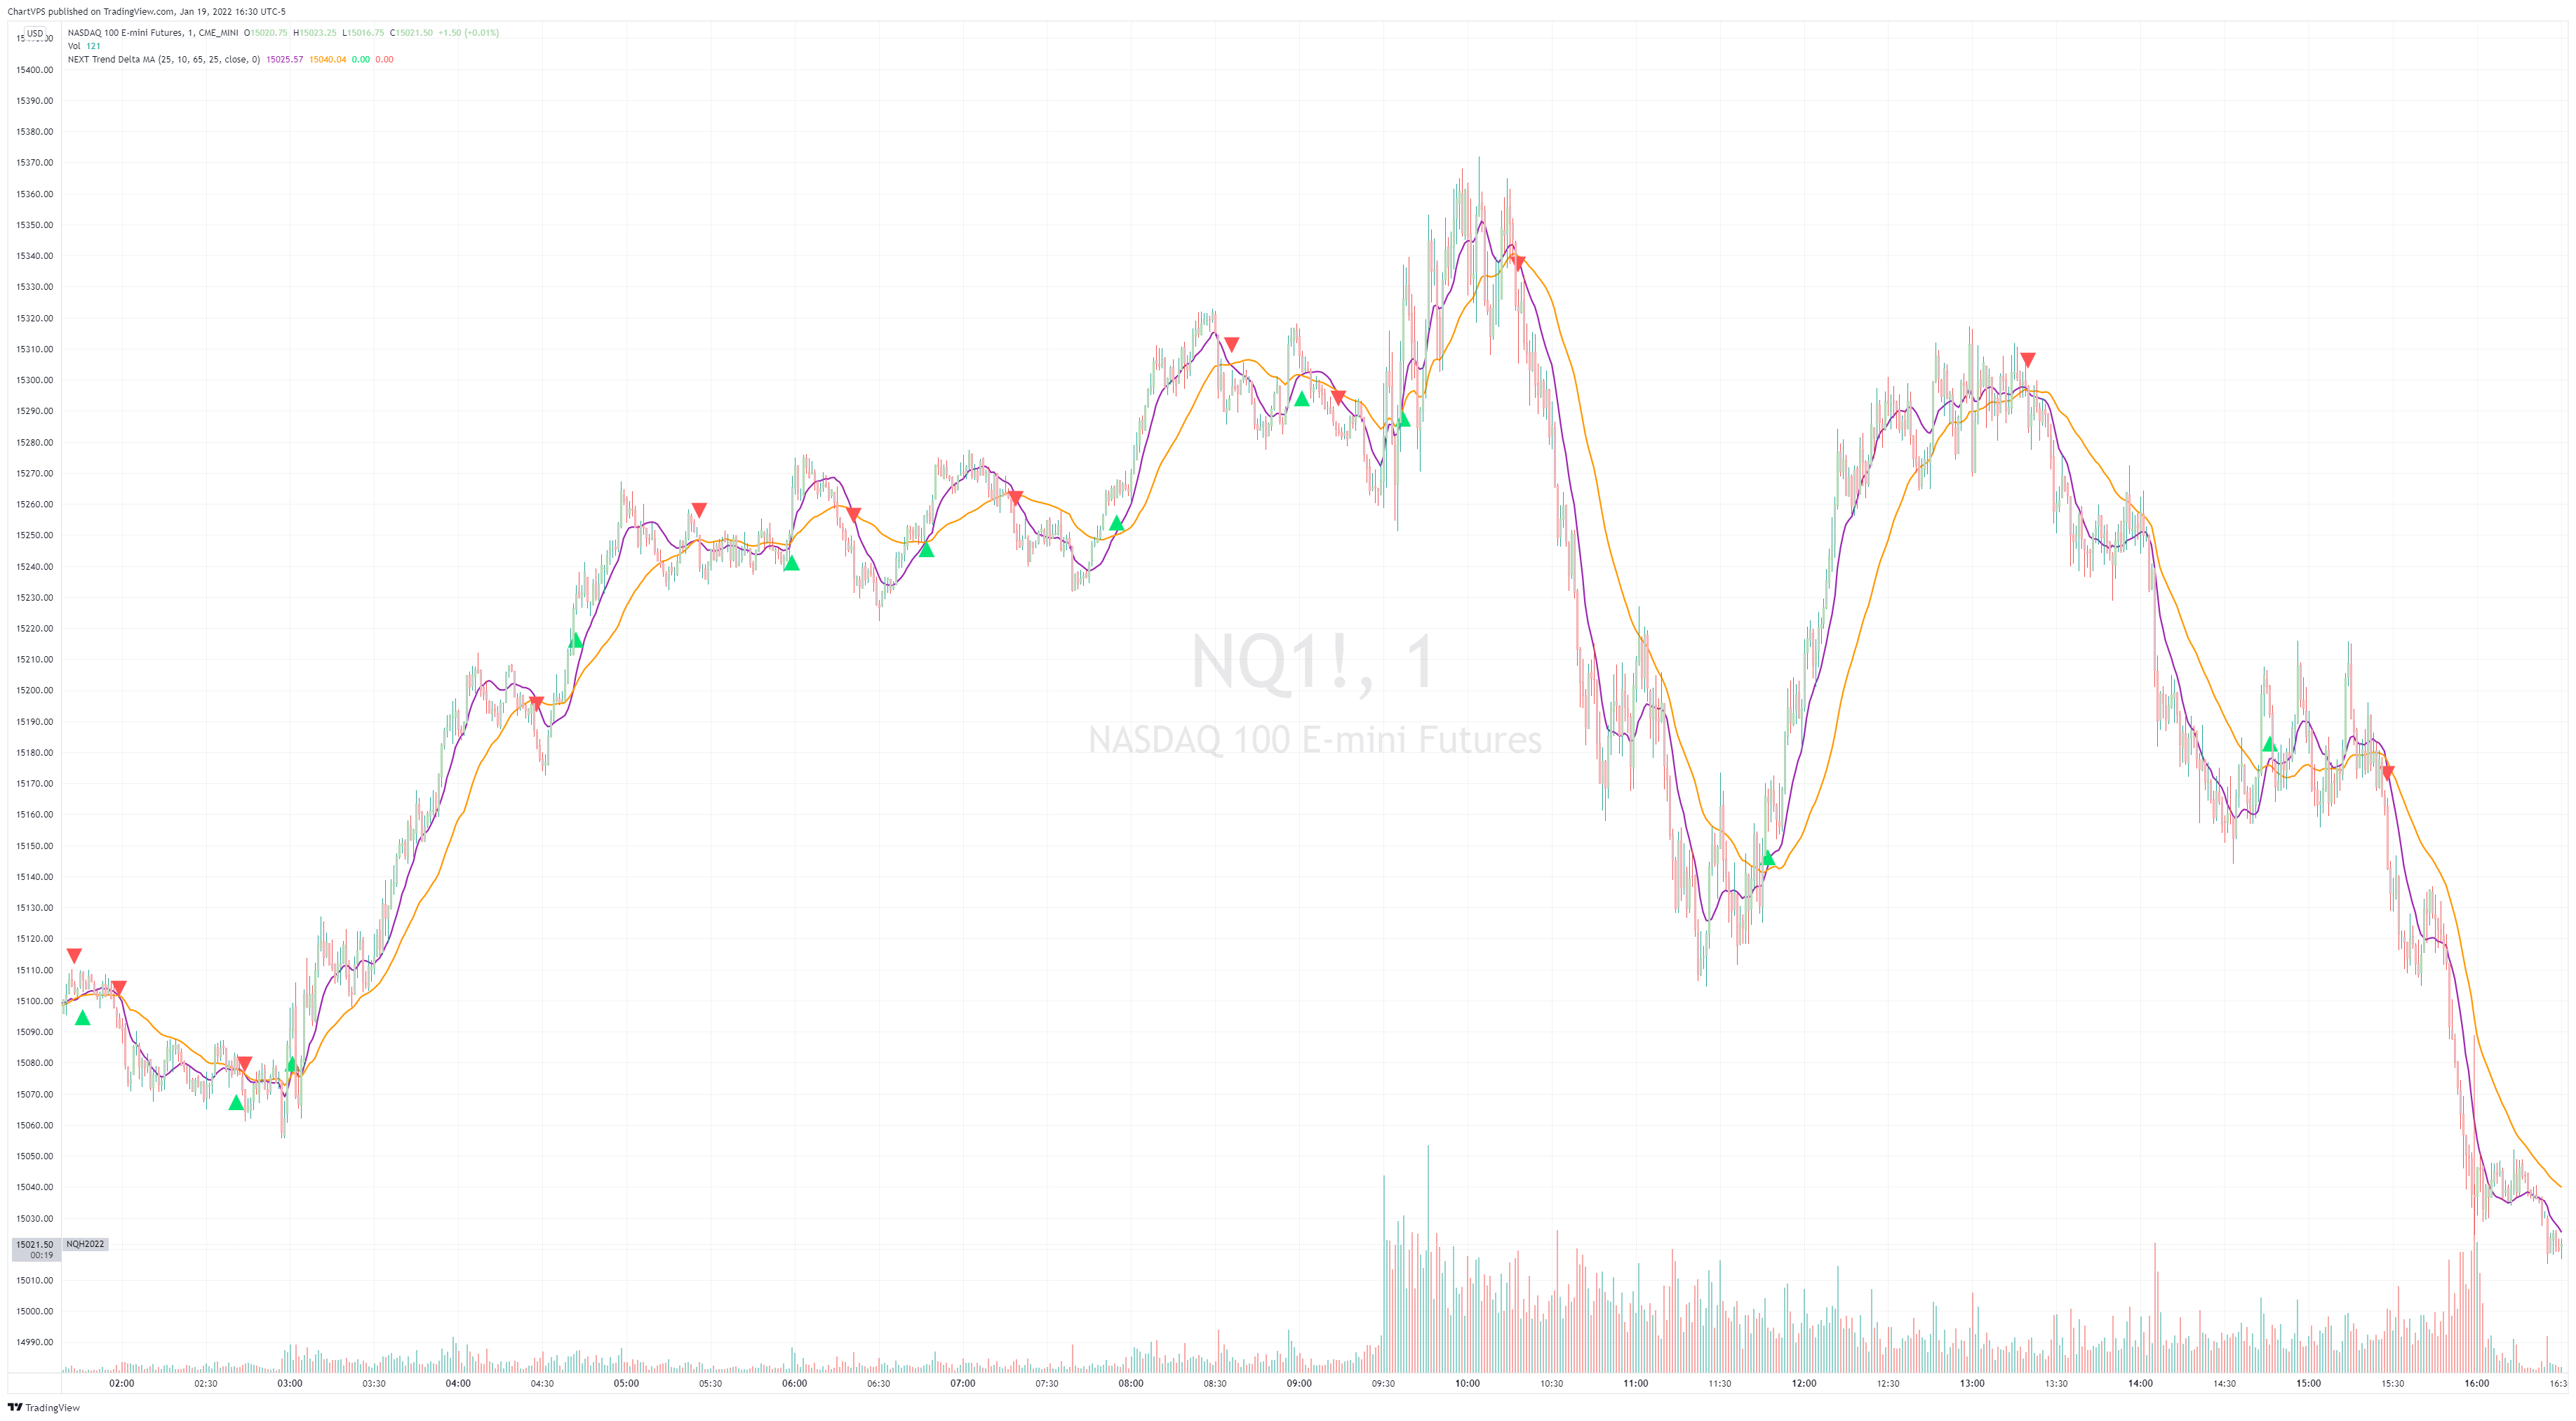
This Nasdaq 100 futures (CME: NQ) example shows both TDMA lines and their crossover signals.
Key Features
- Composite moving average weighted by real-time trend changes in price and volume
- User-configurable lagless filtering
- Option of plotting one or two TDMA lines
- Option of plotting TDMA line crossovers
- Native alerts via TradingView, including price / Trend Delta Moving Average (TDMA) crossovers
- Free, available for TradingView – a free platform
Input Parameters
- Length TDMA1 – length of the first Trend Delta Moving Average (TDMA)
- Length TDMA2 – length of the second TDMA
- Trendiness TDMA1 – the amount of trend weighting added to the first TDMA line (lower = more recent trend, higher = longer term trend)
- Trendiness TDMA2 – the amount of trend weighting added to the second TDMA line (lower = more recent trend, higher = longer term trend)
- Source – data used for calculating the MAs, typically Close, but can be used with other price formats and data sources as well
- Offset – shifting of the TDMA lines forward (+) or backward (-)
- Plot TDMA1 Only – when checked, will only plot a single TDMA line (TDMA1)
- Plot TDMA Crossovers – when checked, will plot an up arrow (long signal) when TDMA1 crosses over TDMA2, and a down arrow (short signal) when TDMA1 crosses under TDMA2
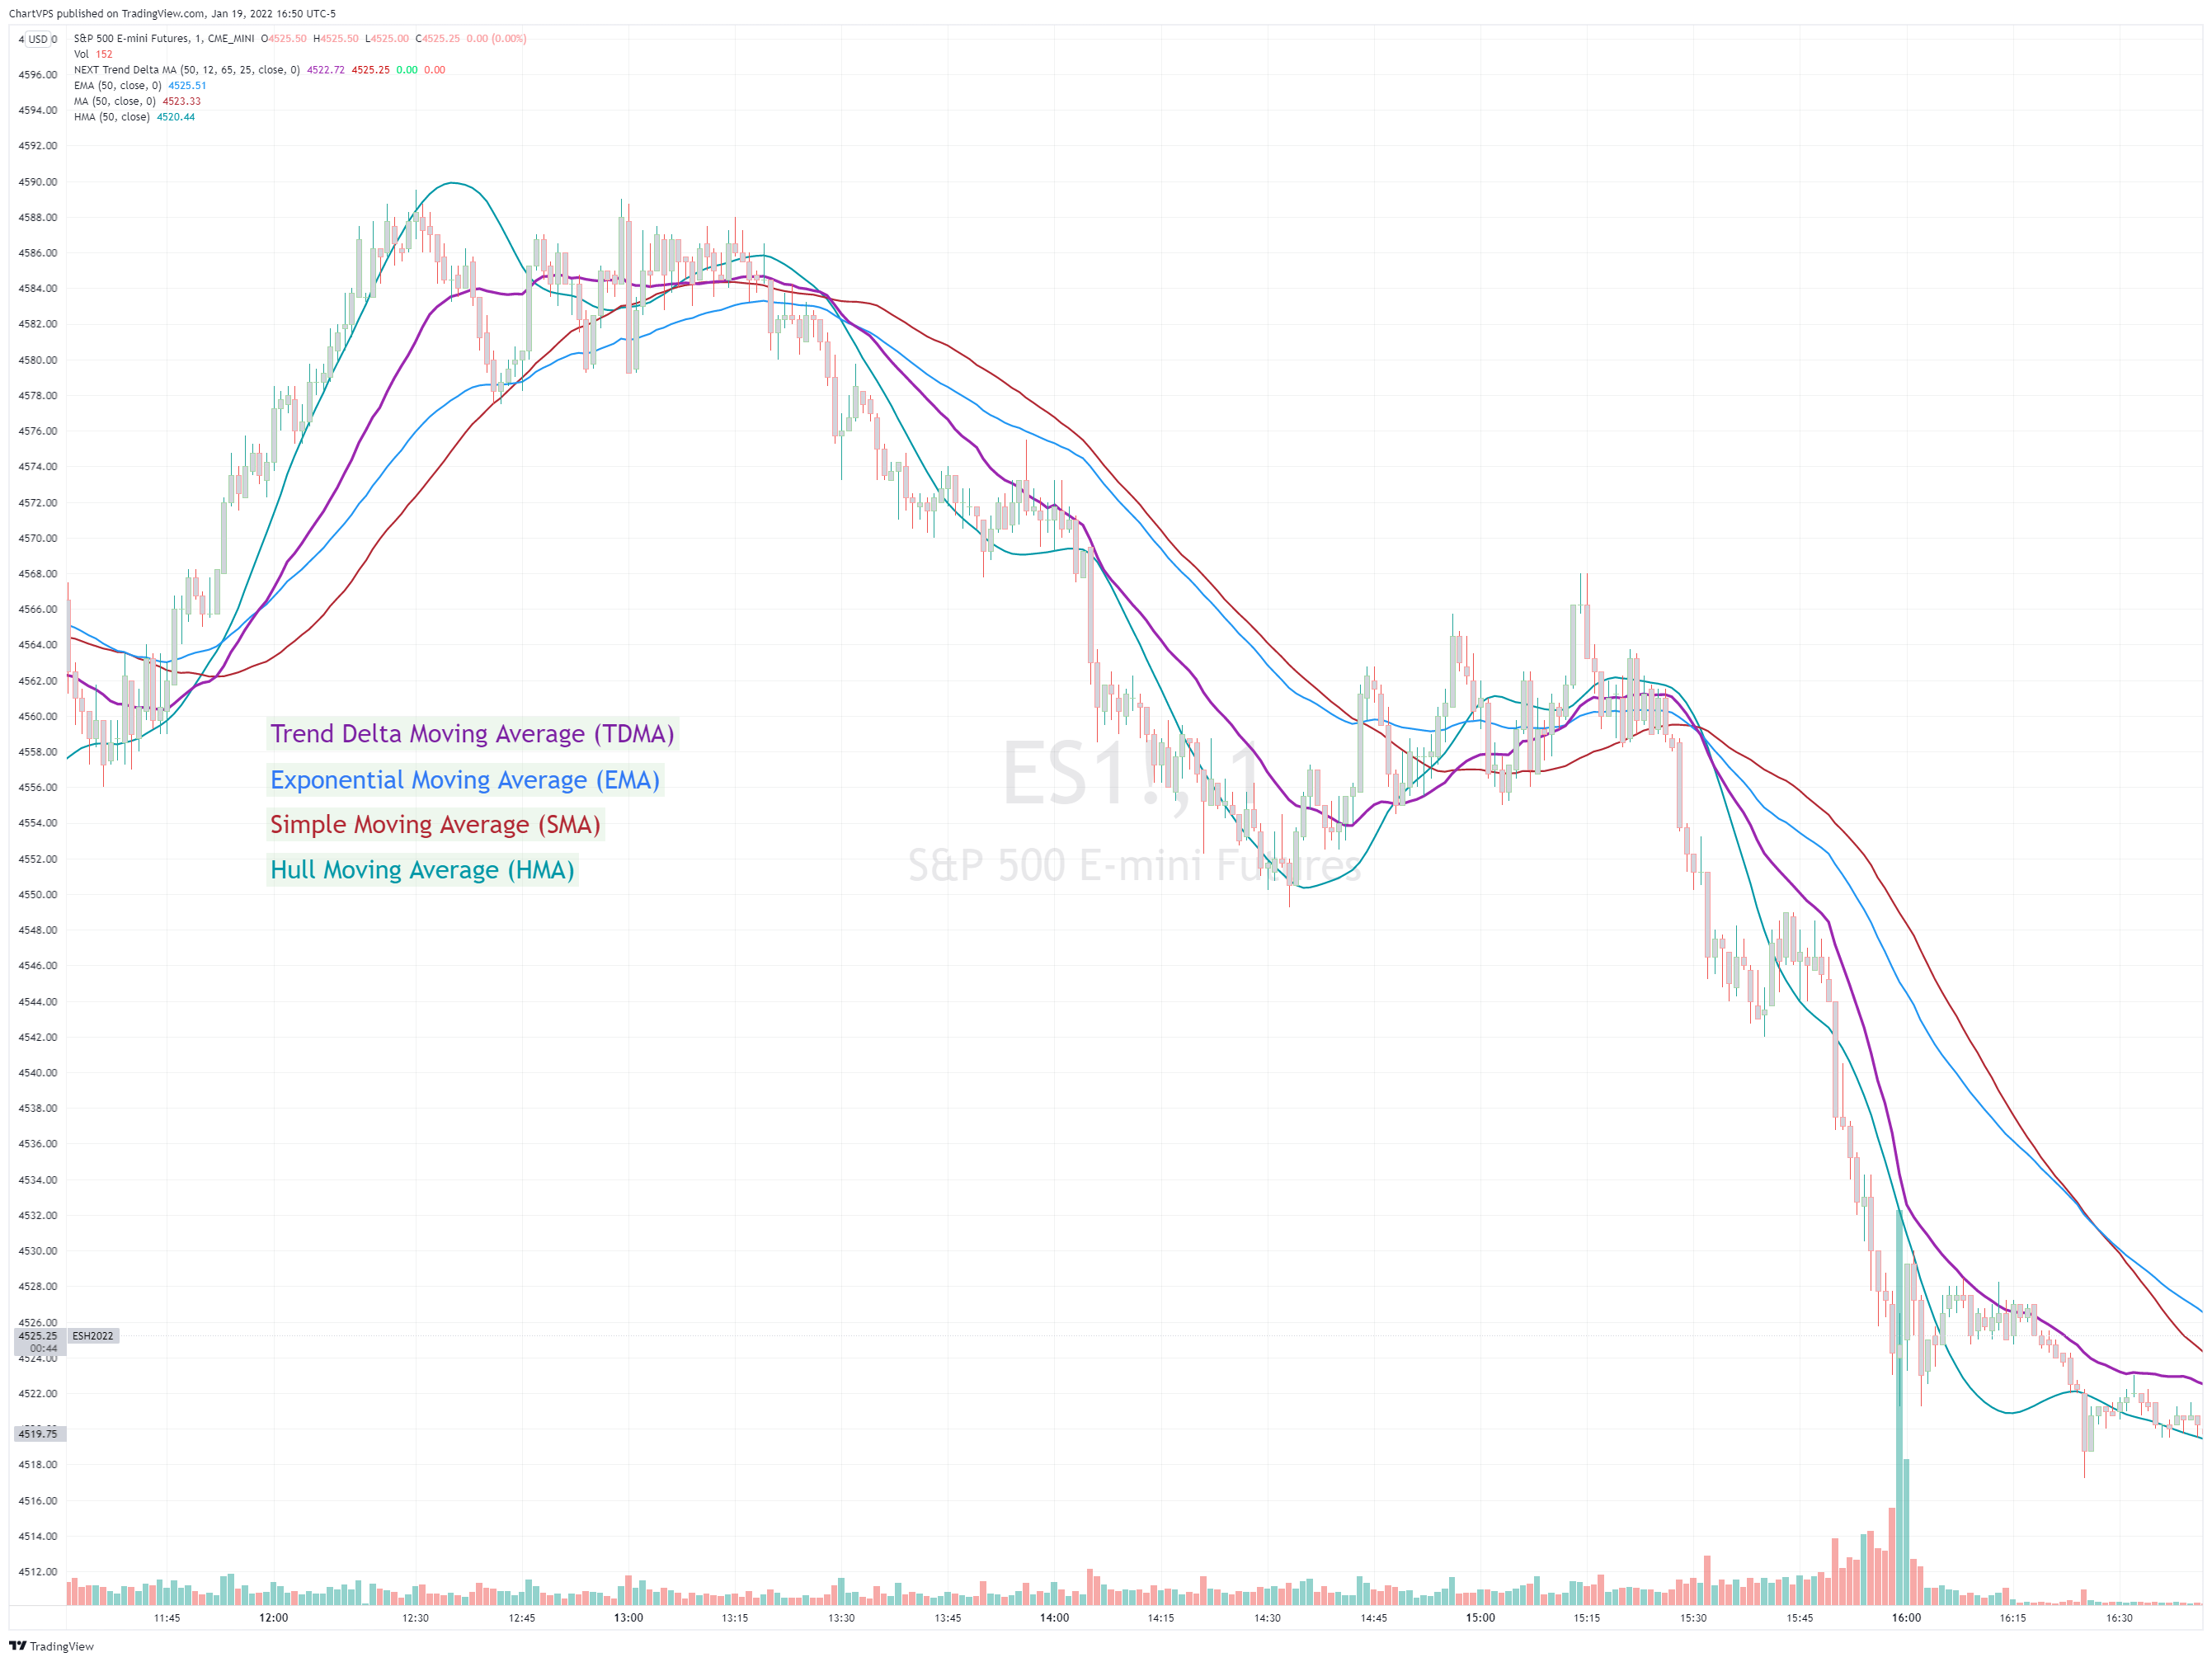
TDMA vs Other Moving Averages
We spent a good amount of effort developing and differentiating Trend Delta Moving Average (TDMA) from other moving averages. We wanted a responsive MA algo that considered price and action, and that incoporated user-controlled lagless filtering (smoothing). Below is a comparison between TDMA (purple) and several popular MA types, including Exponential (blue), Simple (red), and Hull (teal). All MA lengths set to 50.
- Anchor Period – controls the origin of VWAP calculations with start of session being the default.
- Source – data used for calculating the VWAP, typically HLC/3, but it can be used with other data as well.
- Offset – shifting of the VWAP line forward (+) or backward (-).
Strategies
Trend Delta MA Crossovers
Long signal when the faster TDMA1 crosses over the slower TDMA2. For visual signals (arrows) tick Plot TDMA Crossovers within indicator settings. The NQ 1-minute chart below shows TDMA1, length 25 crossing over TDMA2, length 65.
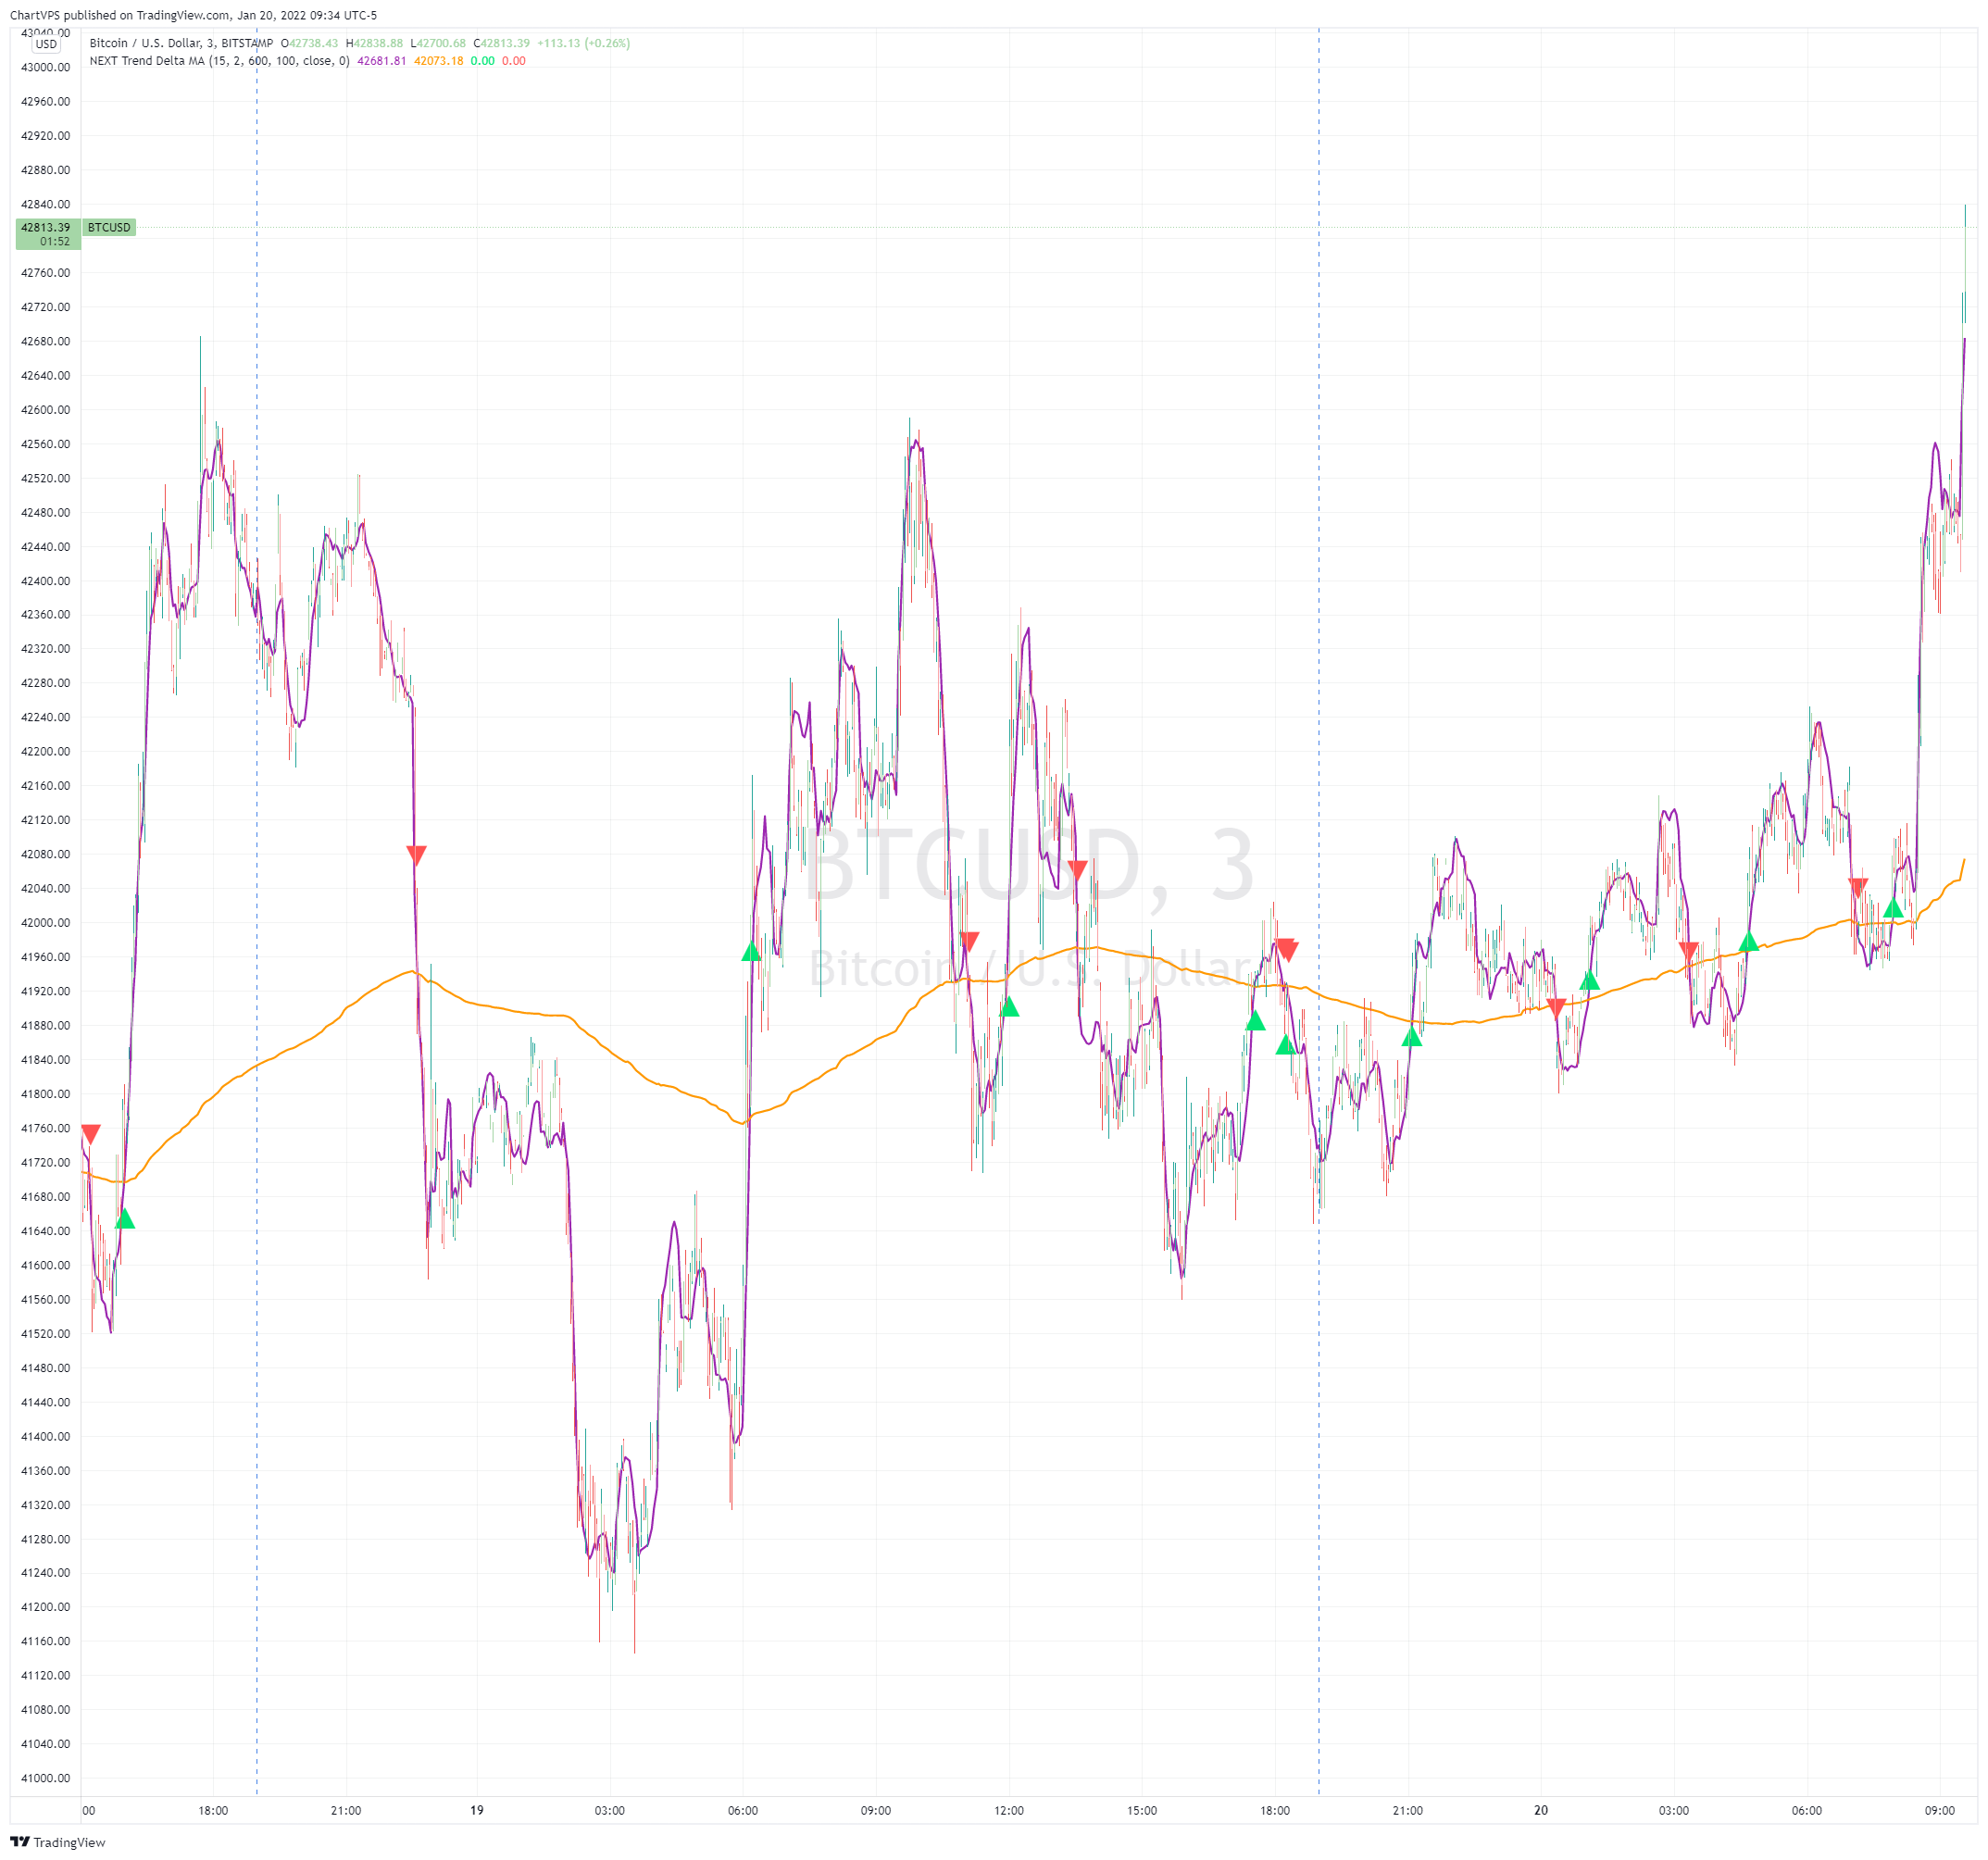
Using a single Trend Delta MA Line
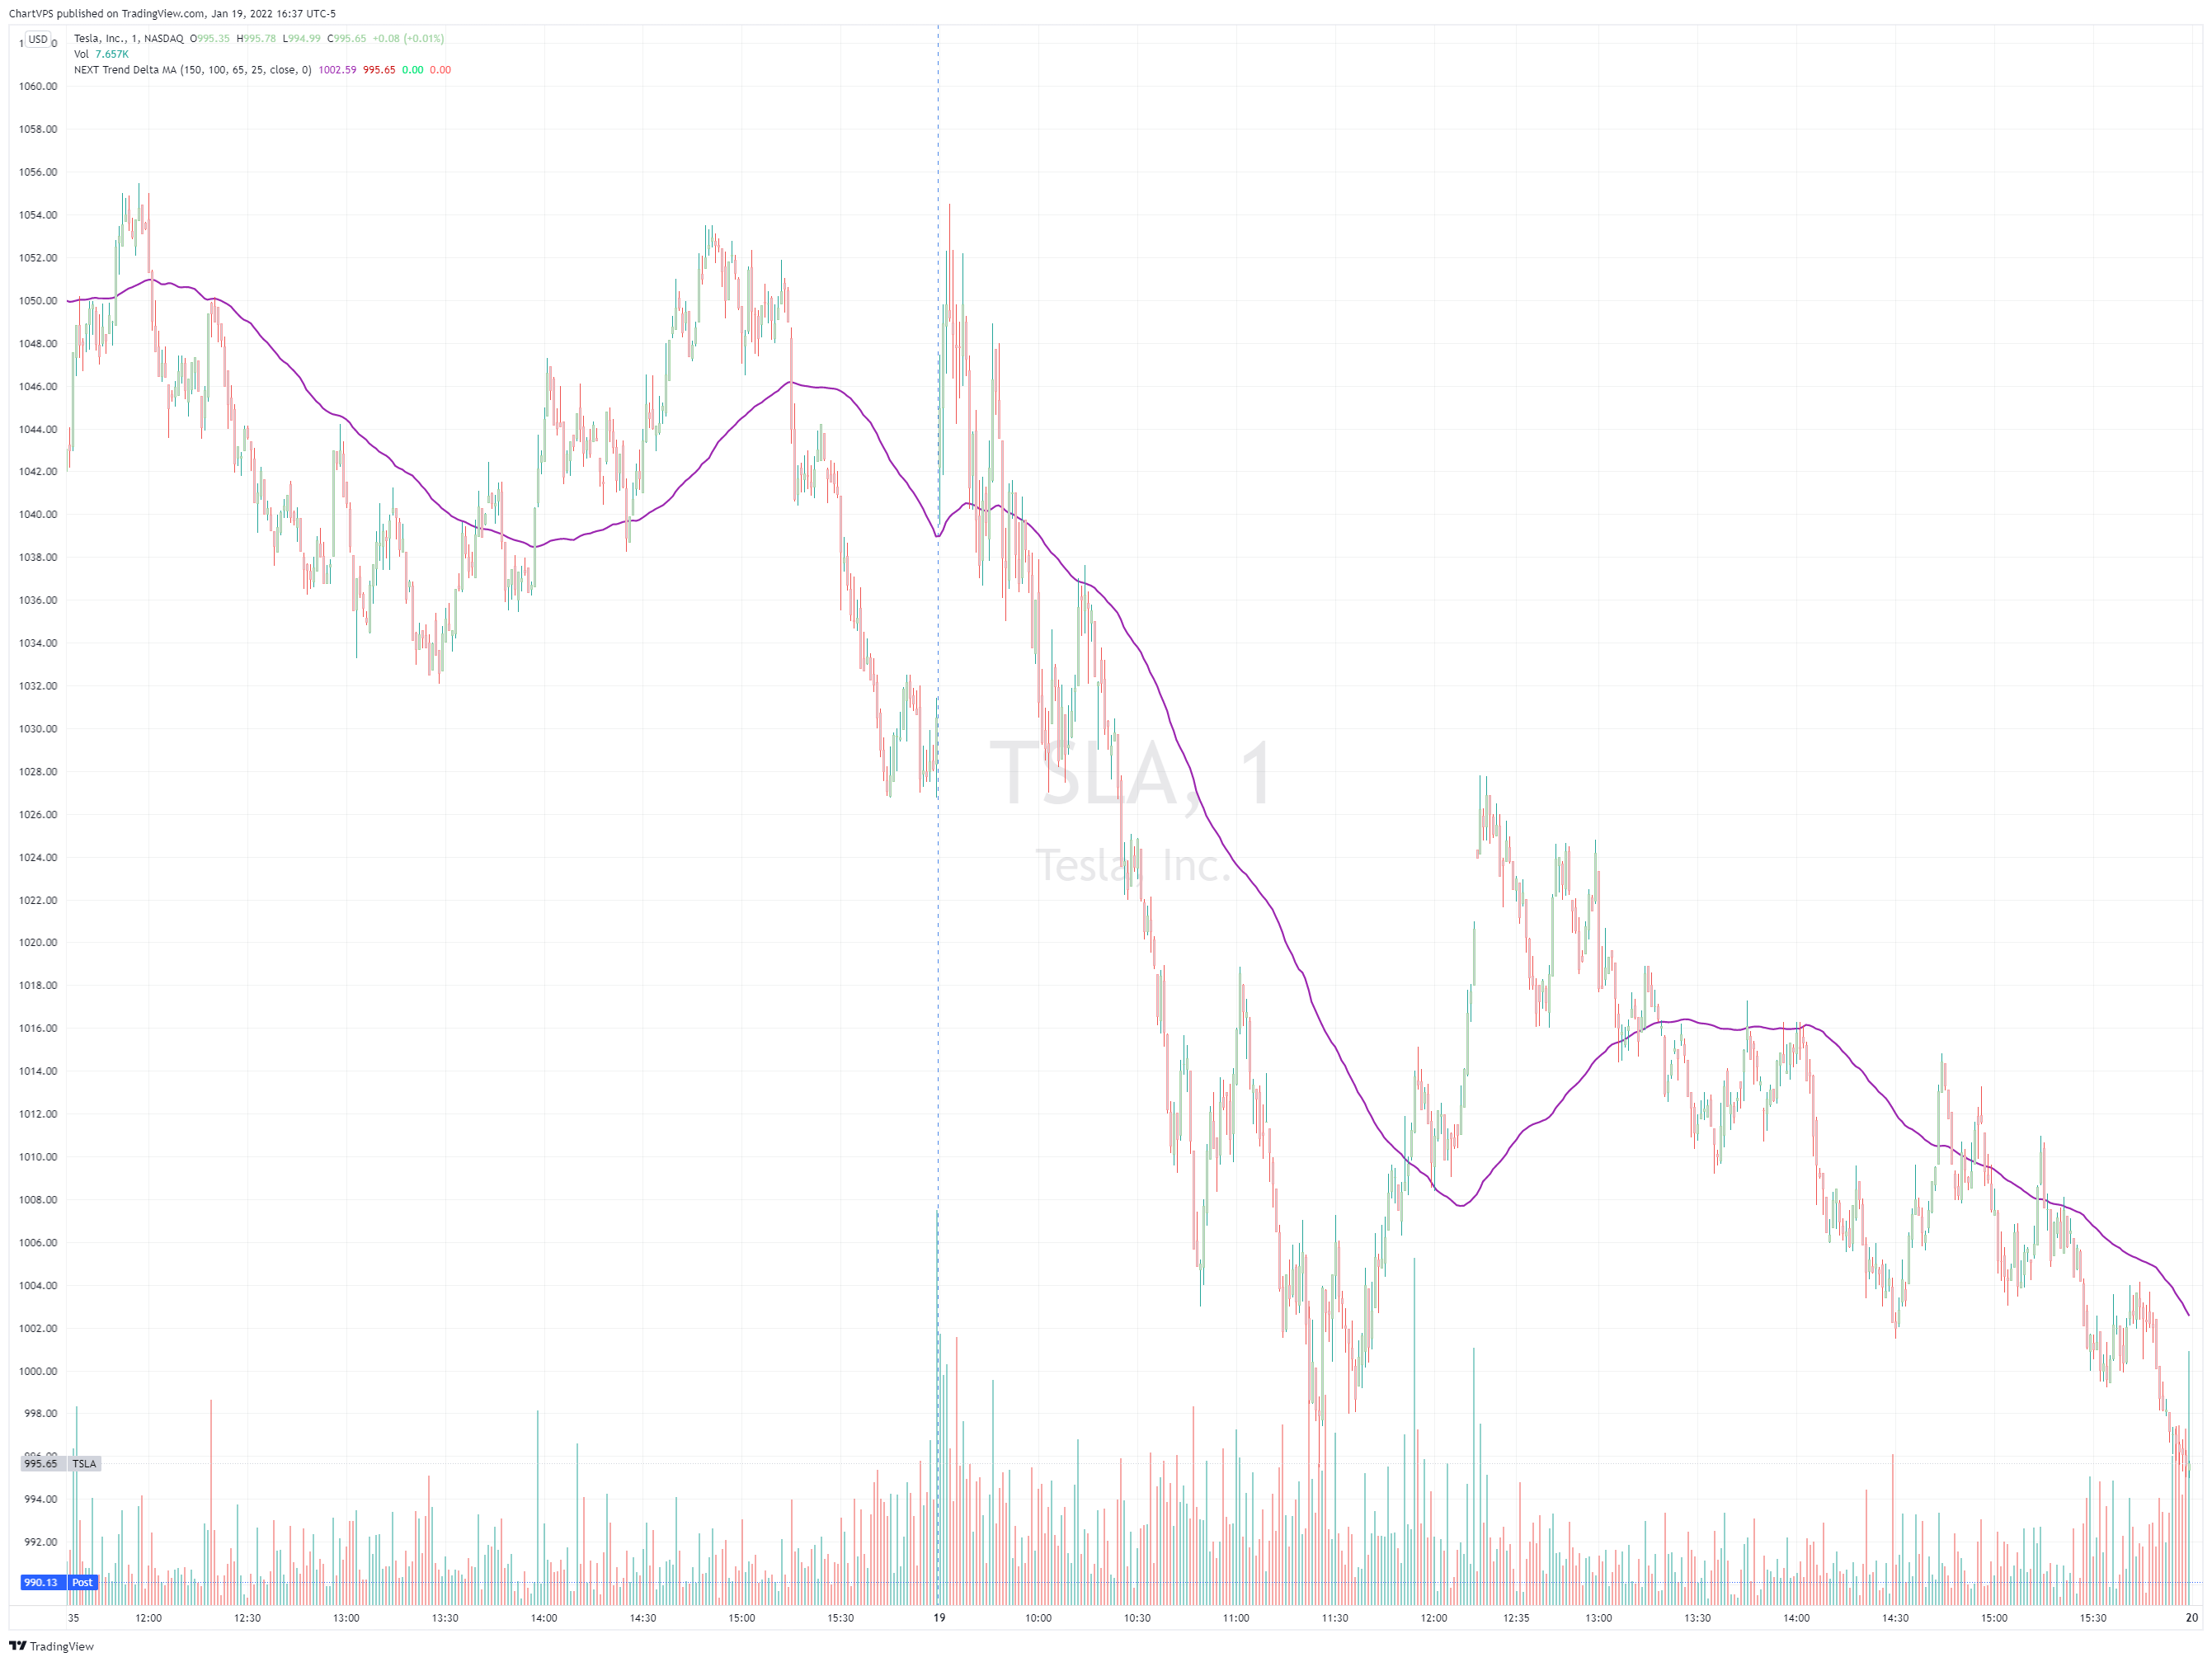
If you trade price / MA crossovers or use moving averages as part of a broader trading system, you have the option of displaying a single TDMA line without any crossover signals (arrows) by ticking [i]Plot TDMA1 Only checkbox[/i] and unticking [i]Plot TDMA Crossovers[/i]. Great for breakout stocks like Tesla (NASDAQ: TSLA), pictured below.
Lagless Smoothing
You may use the Trendiness input parameter to control the amount of smoothing applied to individual or both TDMA lines. Lower values (emphasis on more recent trends) produce vertically tighter slopes, with TDMA following price action more closely, while higher values (emphasis on more longer term trends) relax the slope, without introducing horizontal (time) lag.
Signals and Alerts
Price / TDMA Crosses
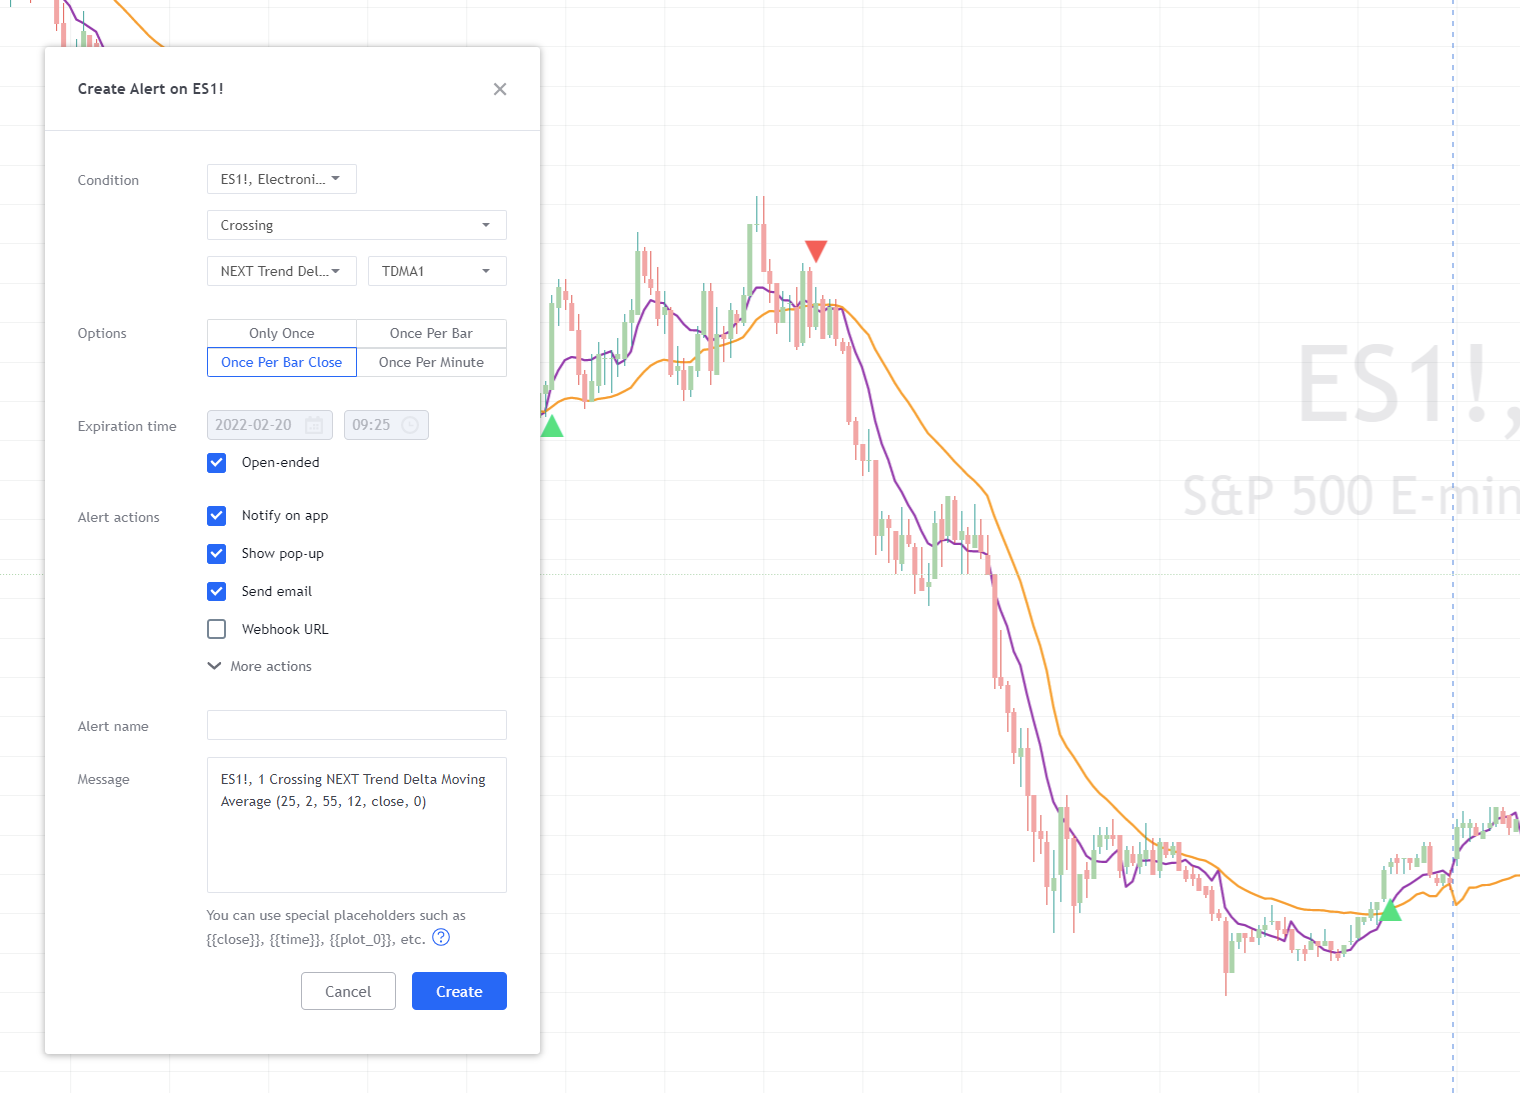
Here is how to set price crossing TDMA1 (or TDMA2) alerts: open a TradingView chart, attach NEXT Trend Delta Moving Average (TDMA), right-click on chart -> Add Alert. Condition: Symbol (e.g. NQ) >> Crossing >> NEXT Trend Delta Moving Average (TDMA) >> TDMA1 >> Once Per Bar Close.
TDMA1 / TDMA2 Crosses
- Open a TradingView chart, attach NEXT Trend Delta Moving Average (TDMA), right-click on chart -> Add Alert.
- Condition: click on the first drop-down list in the top-left (usually a symbol) and select NEXT Trend Delta Moving Average. To the right of that field there is another drop-down list – select Long or Short (you can always add a second alert after to cover the other condition).
- Click on the field under and select Greater Than.
- Underneath that, leave Value and to the right of it enter 0.
- Under Options select Once Per Bar Close.
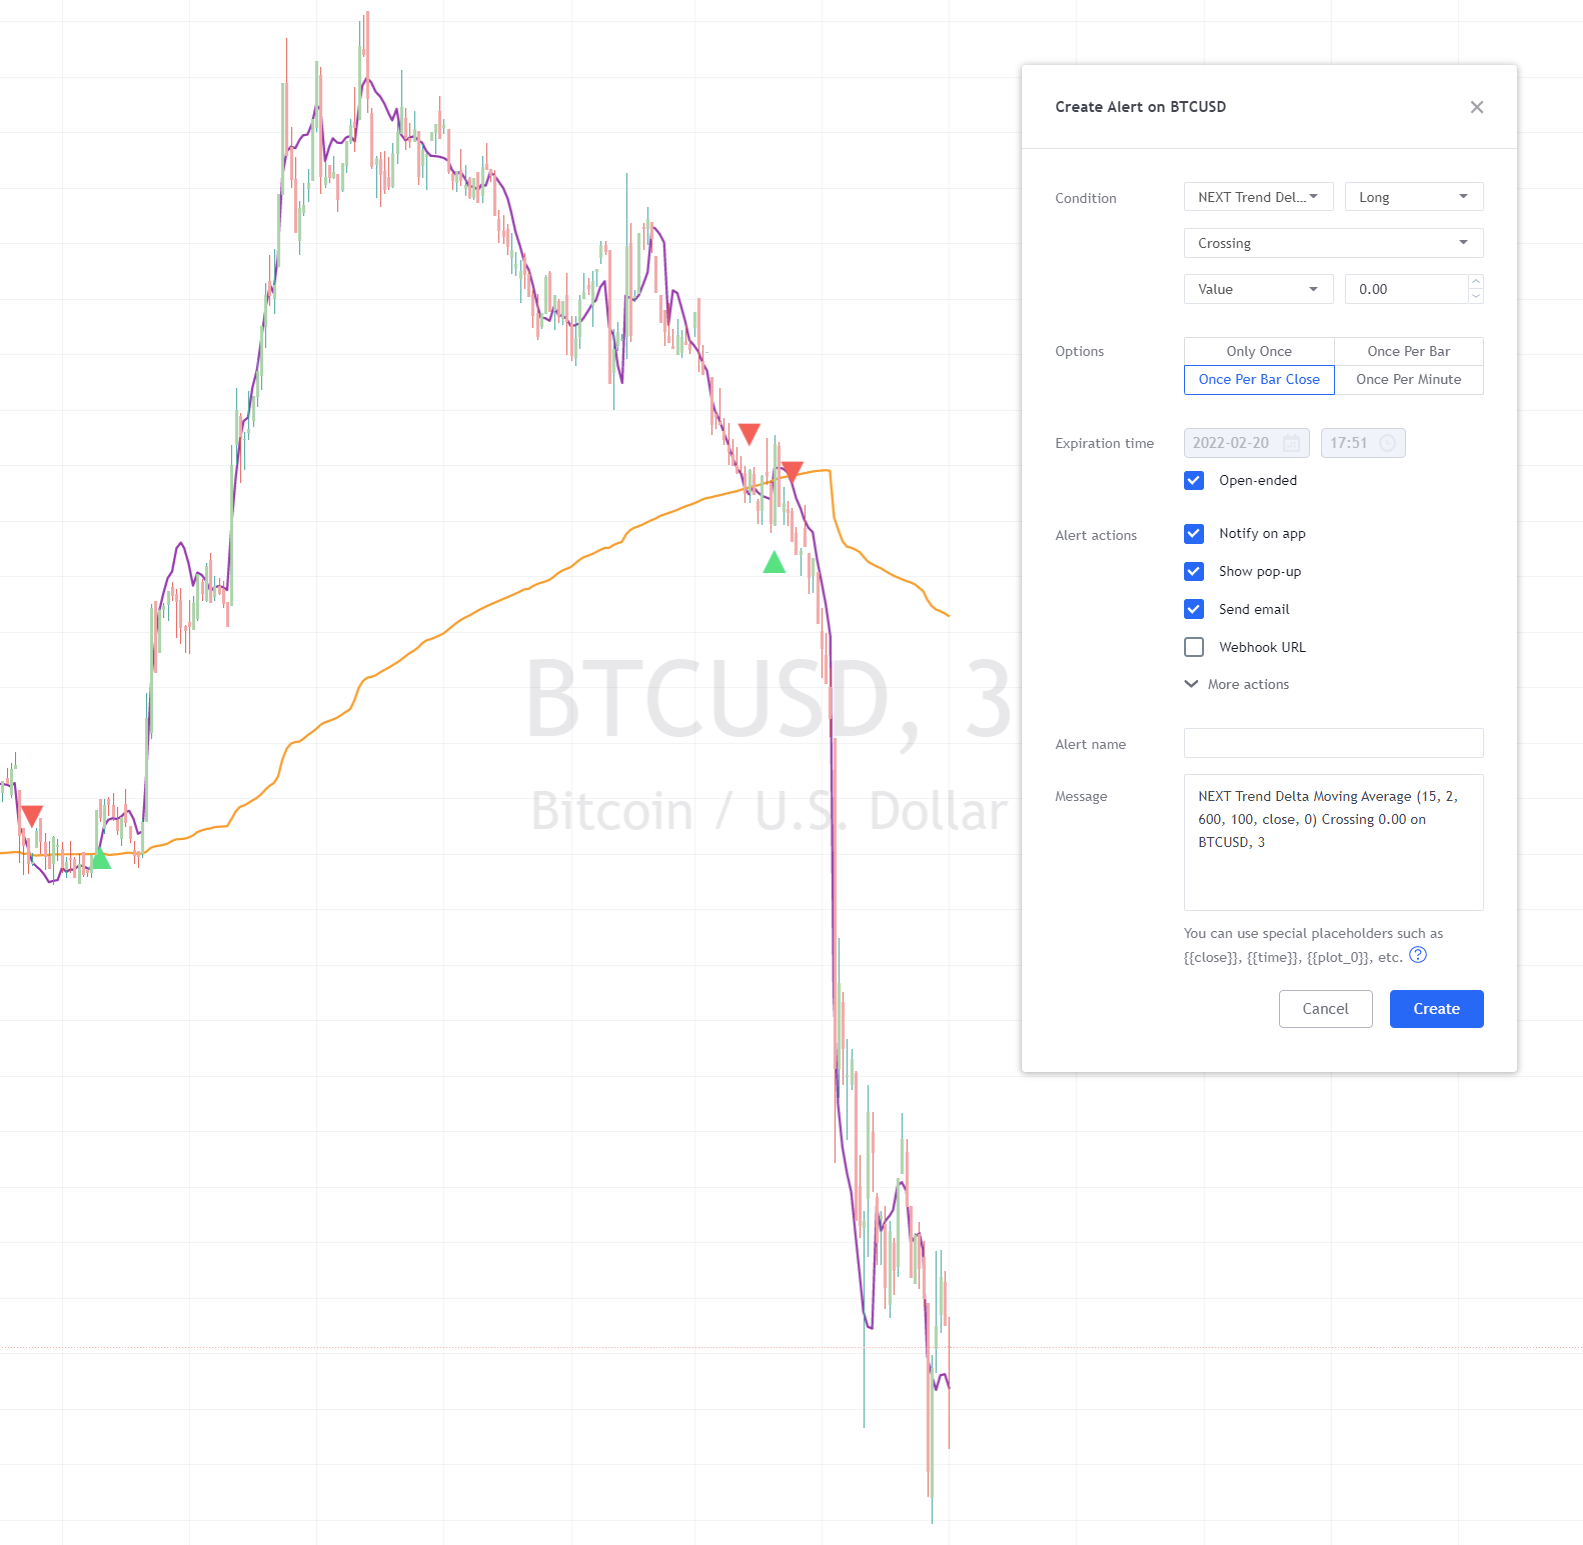
That’s it, you will receive a pop-up, audio, email, and/or SMS alert (depending on which alerts you selected) every time the two TDMA lines cross
Download
TradingView is our platform of choice for publication of the NEXT framework (indicators, strategies, etc.). The platform is free to use (Basic plan) with optional paid features, if you need them. You don’t for NEXT when using a single chart. Their fair approach to empowering retail traders aligns with ours. Trading should not be exclusive to hedge fund managers and professional traders. You can find all of our algo-driven software on the ChartVPS TradingView Scripts page. If you do decide to go with a paid version of TradingView (not required for ChartVPS NEXT), you can use this link to get up to $30 off.


