


Overview
Key Features
- Plottable historic and real-time signals (long entry, short entry, long exit, short exit) for all ChartVPS NEXT indicators
- Compatible with many non NEXT indicators
- Applications include strategy discovery, backtesting, and discretionary trading
Input Parameters
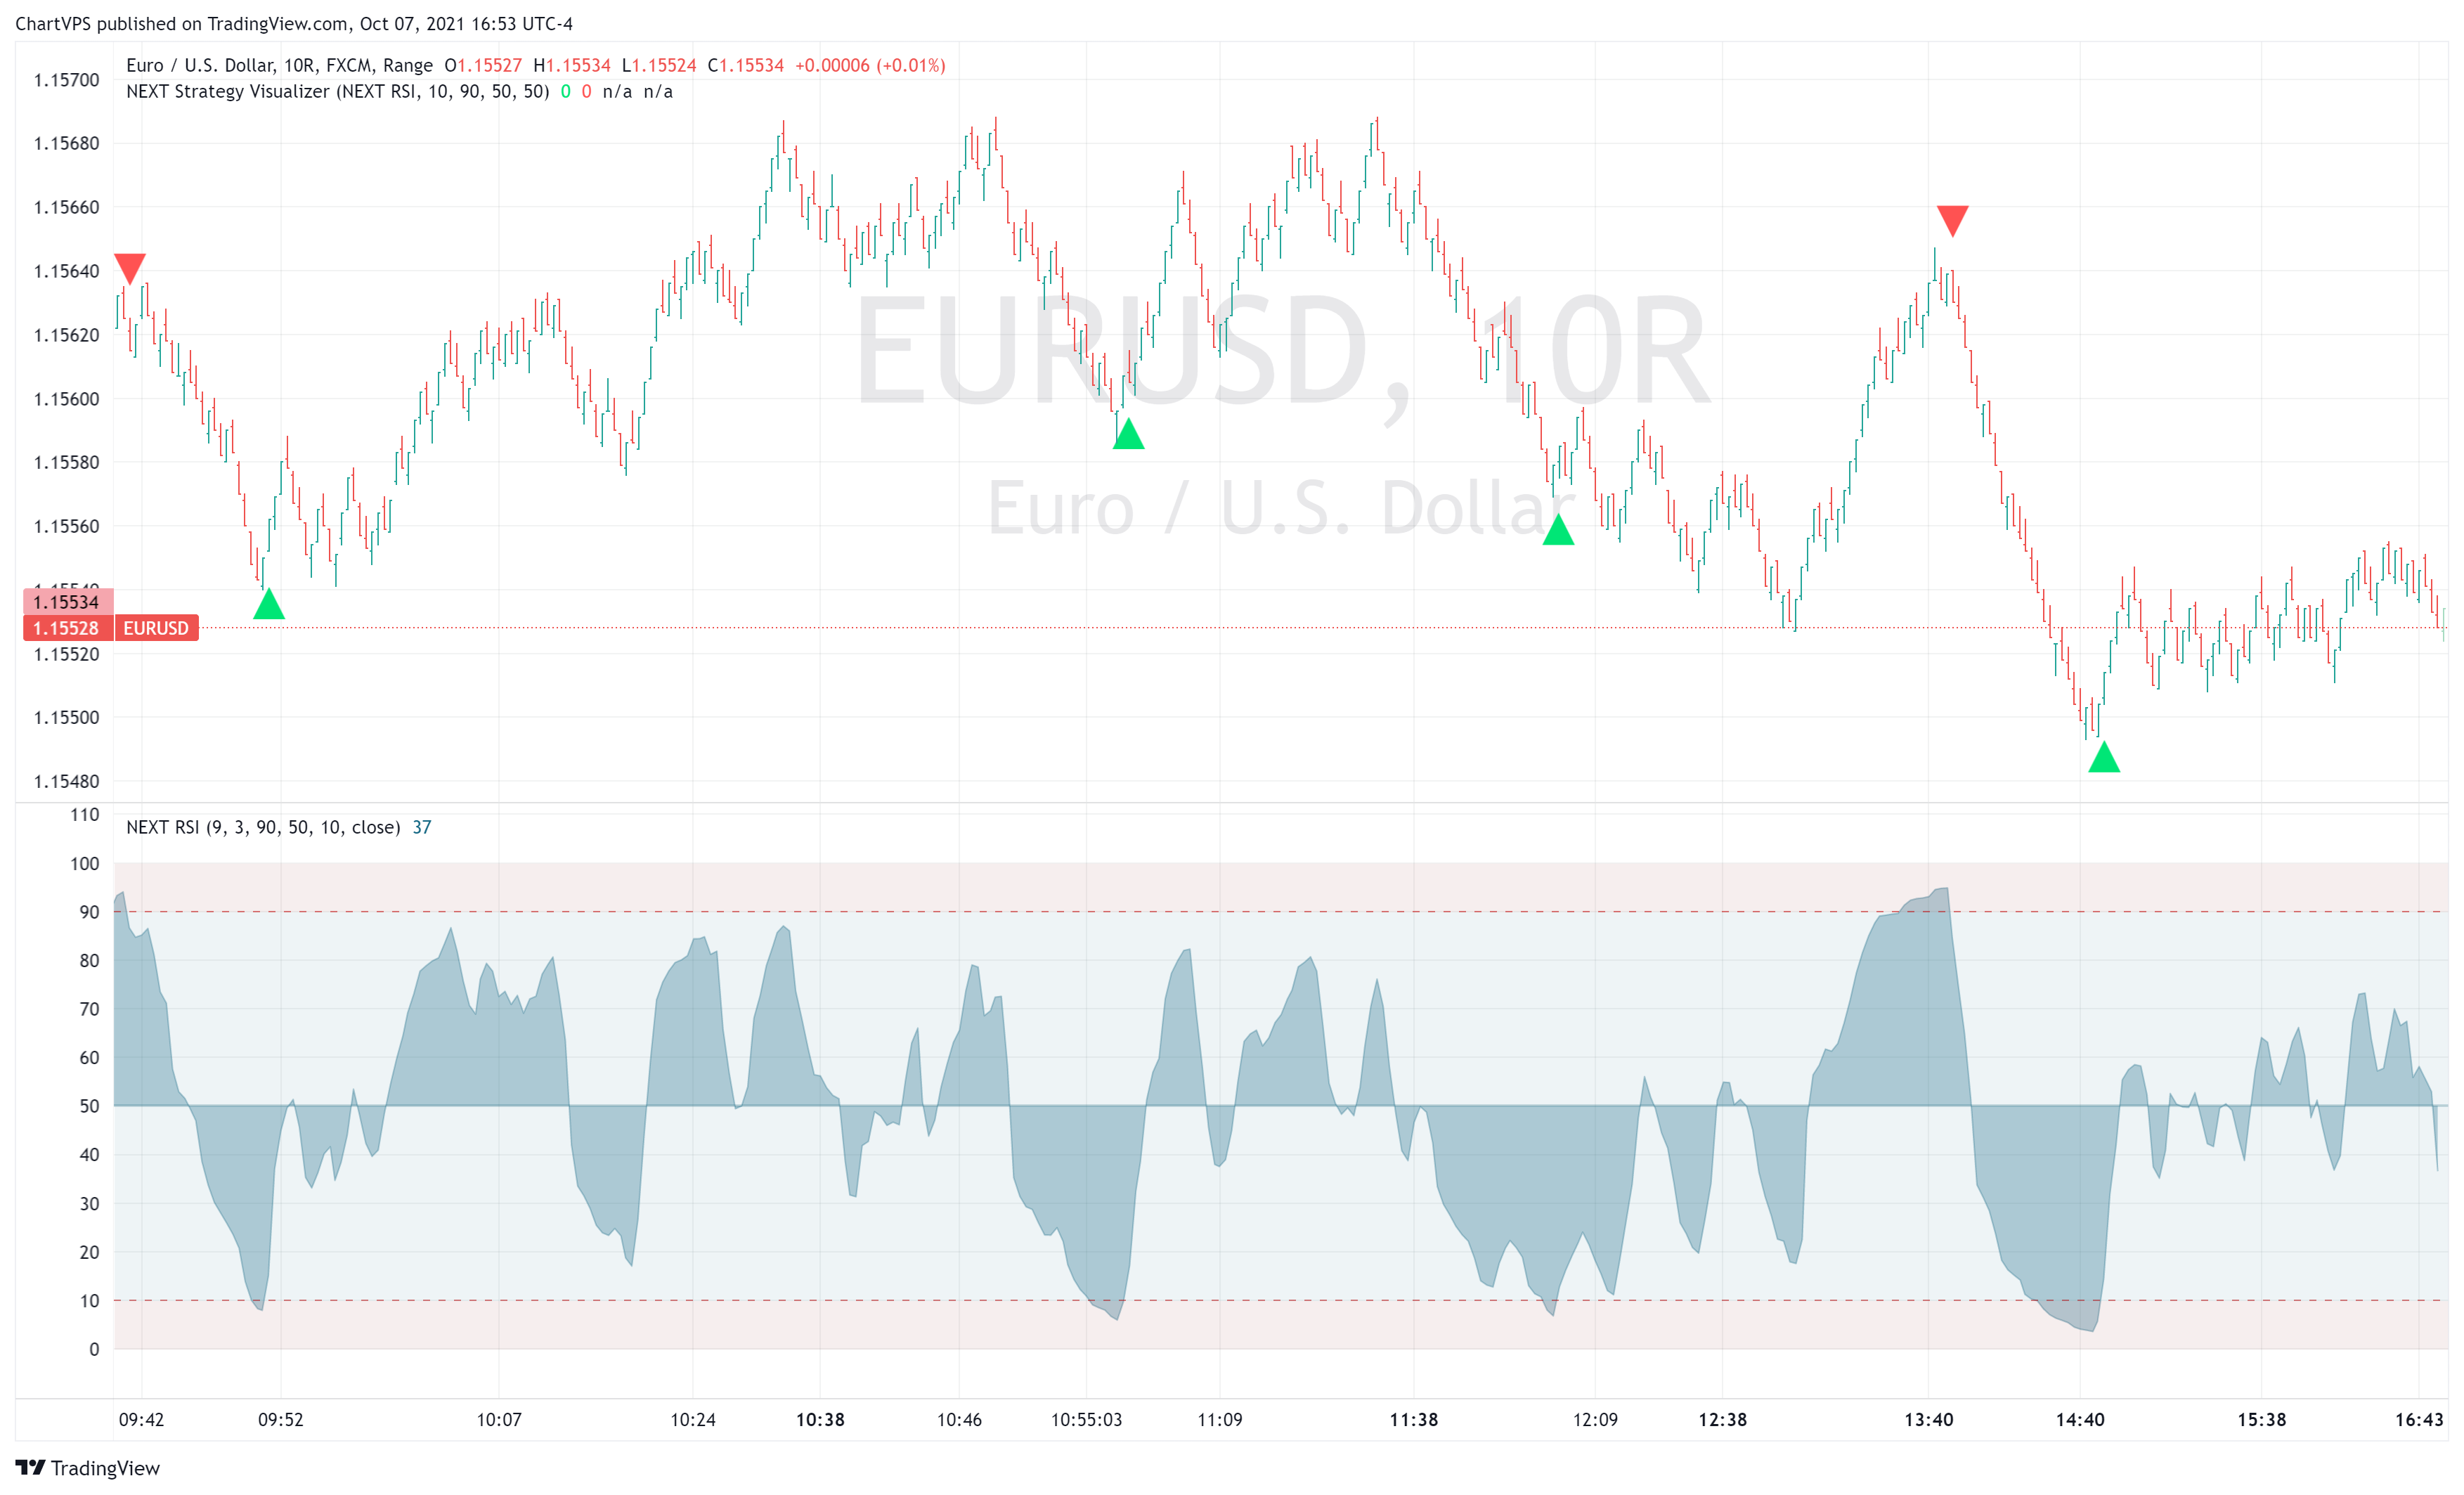
- Signal Source -This should be set to whichever NEXT add-on strategy you wish to visualize. In the example above, it is NEXT RSI. Signal Source will also take any other built-in or 3rd party TradingView indicator.
- LE Level – When this level is crossed from below, a long entry signal is displayed on the chart. In the EURUSD example above, we used 10. Putting it together: when the NEXT RSI line (as selected in the Signal Source) crosses above 10, an up arrow, representing a long signal, is drawn.
- SE Level – When this level is crossed from above, a short entry signal is displayed on the chart. In the EURUSD example above, we used 90. Putting it together: when the NEXT RSI line (as selected in the Signal Source) crosses below 90, a down arrow, representing a short signal, is drawn.
- Use LX/SX – Checking this box will enable the next 2 parameters, LX Level and SX Level, intended for long exit and short exit signals.
- LX Level – When this level is crossed from above, a long exit signal, in the form of a green “X”, is displayed on the chart. For example, if we wanted to exit a long signal when RSI reaches and retraces under 75, we would set this value to 75. This way, an up arrow would be drawn at 10 and an “X” at 75.
- SX Level – When this level is crossed from below, a short exit signal, in the form of a red “X”, is displayed on the chart. For example, if we wanted to exit a short signal when RSI reaches and retraces over 25, we would set this value to 25. This way, a down arrow would be drawn at 90 and an “X” at 25.
Important: In order to effectively use the NEXT Strategy Visualizer you must attach both the indicator you wish to visualize (NEXT RSI in our example) and the NEXT Strategy Visualizer indicator itself.
Strategies
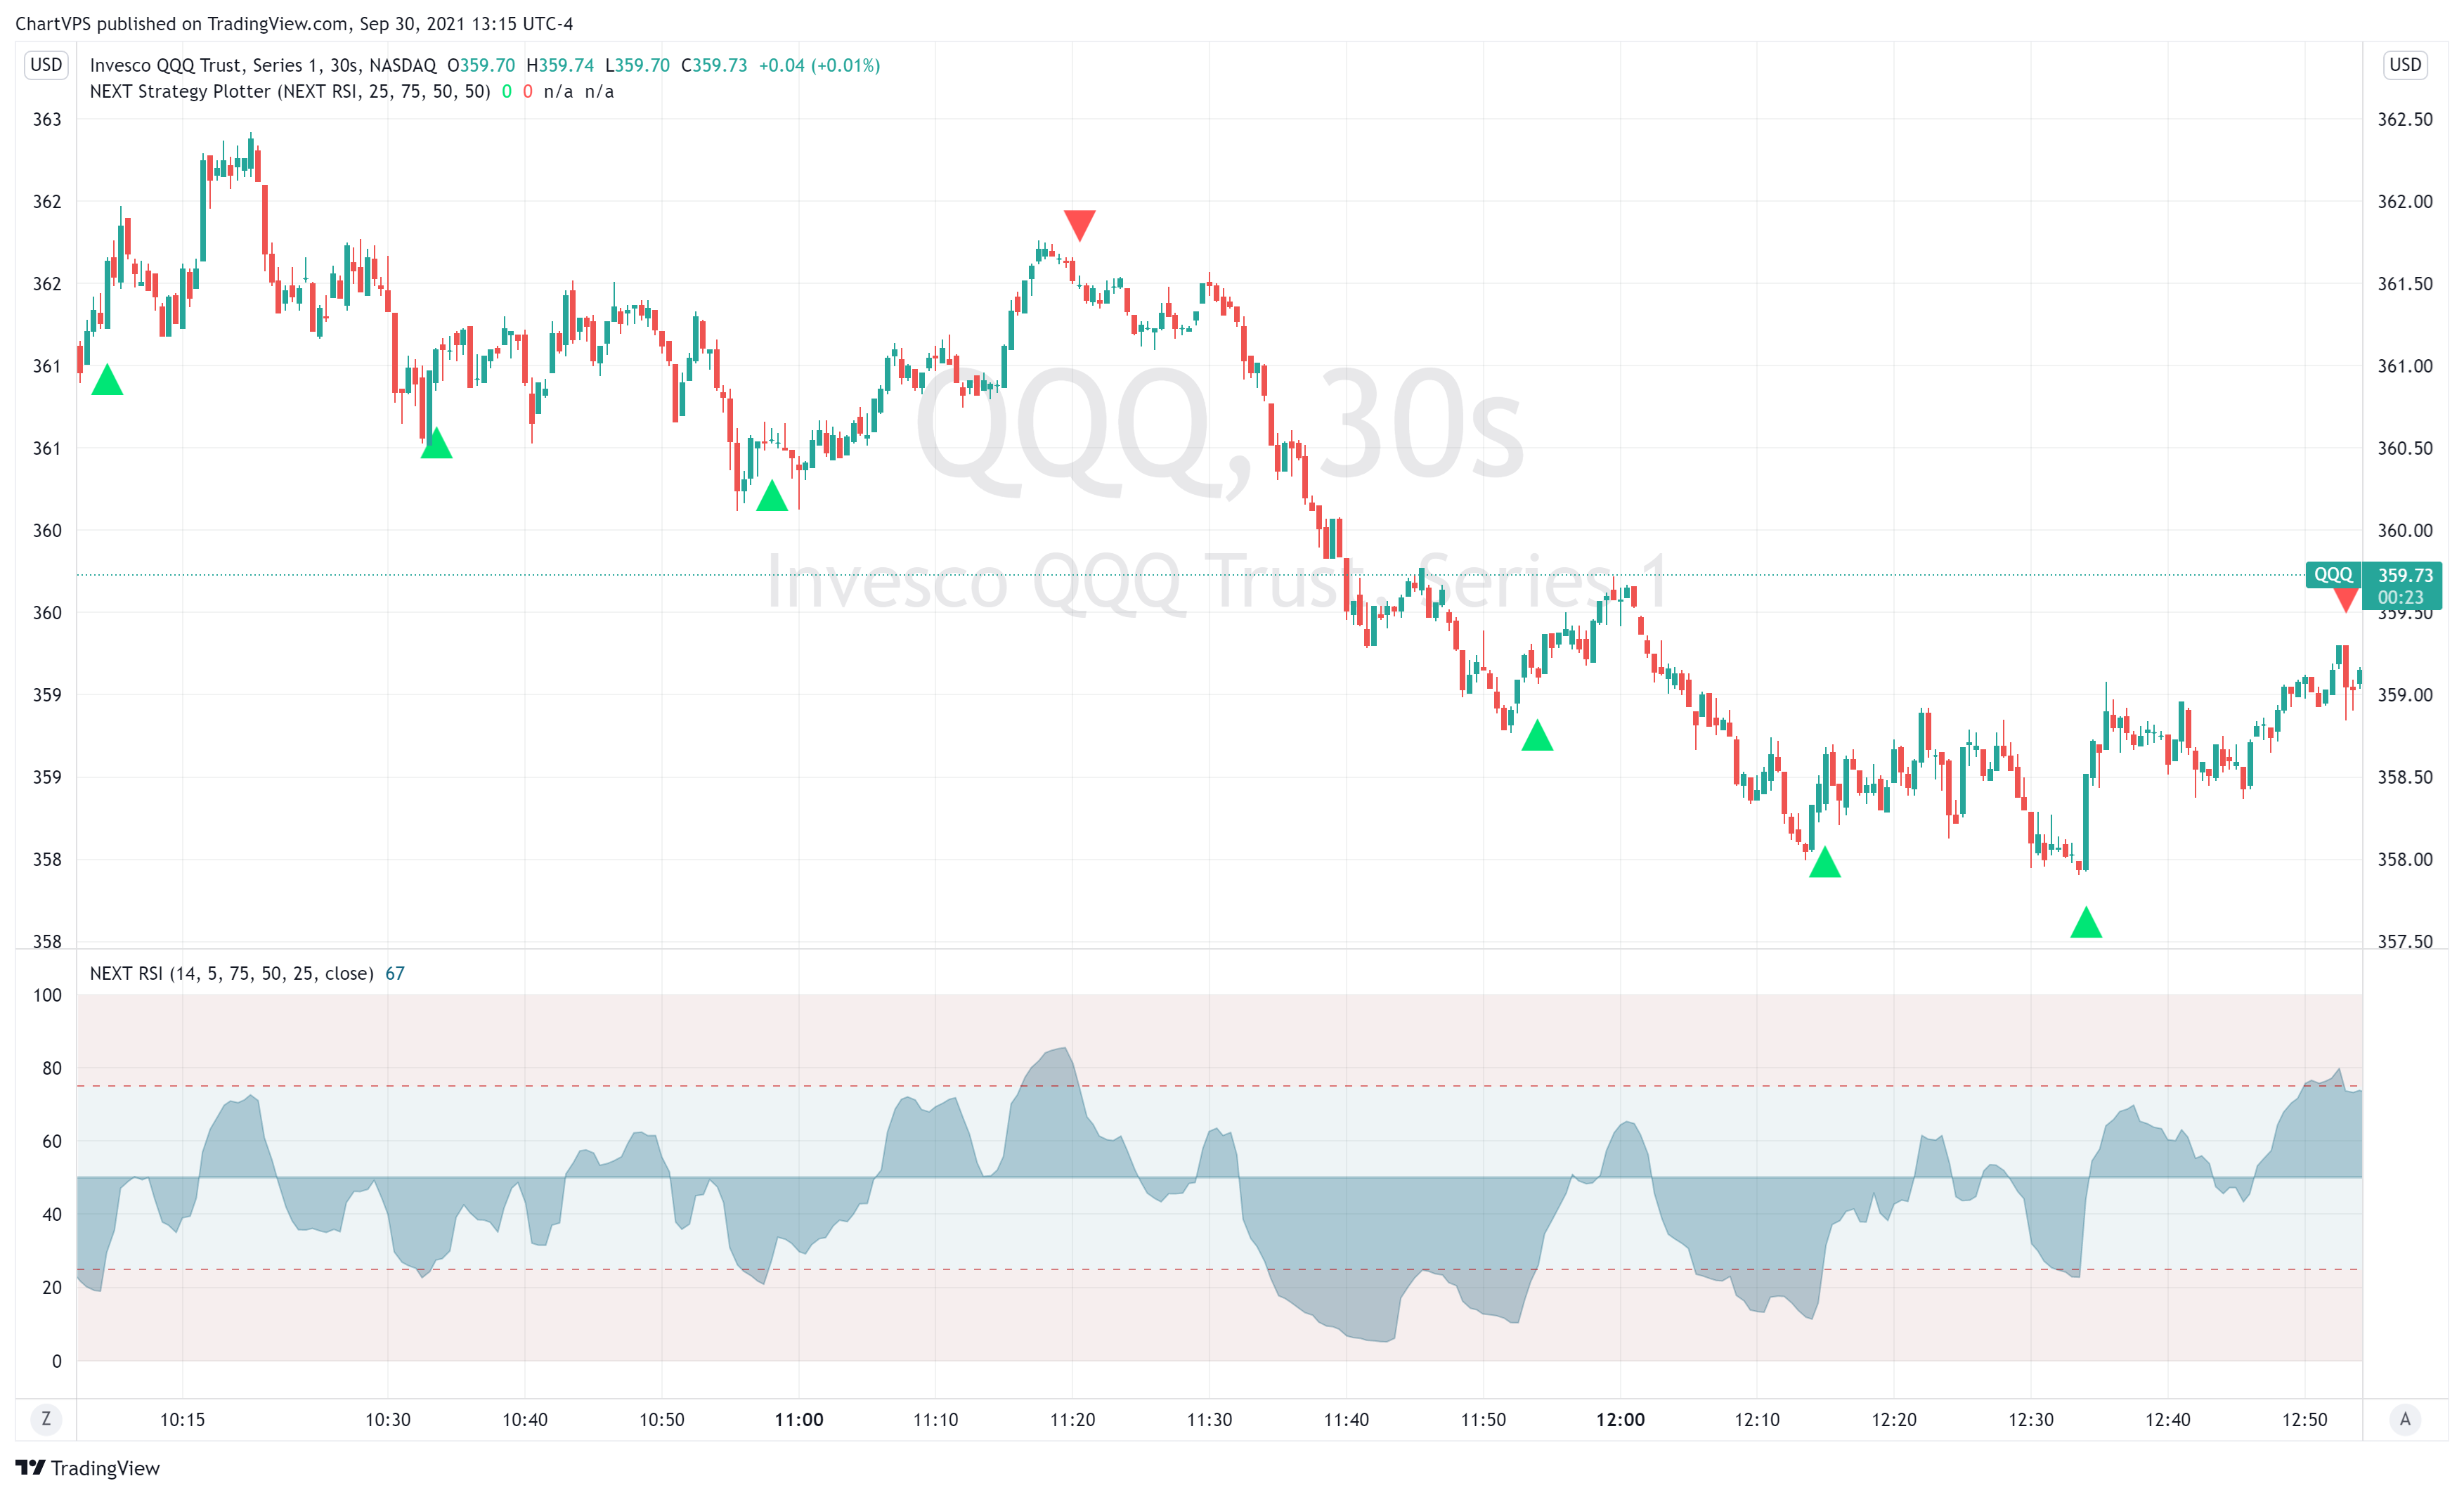
Momentum Play on QQQ 30-sec Chart
Below is another NEXT RSI strategy example, this time momentum play (scalping) on QQQ (Nasdaq-100 ETF) 30-second chart, using Strategy Visualizer’s signals.
Momentum Play on Nasdaq-100 (NQ) 45-min Chart
Simple overbought-oversold momentum play using NEXT RSI, which blends volume analysis with momentum. Volume weighing of the algo reduces the lag and improves accuracy over vanilla RSI as volume often precedes price action. This is a contra-trend (momentum exhaustion) scalping strategy – use order management (TP, SL, trailing stops) and do not trade signal to signal (e.g. long-short-long).
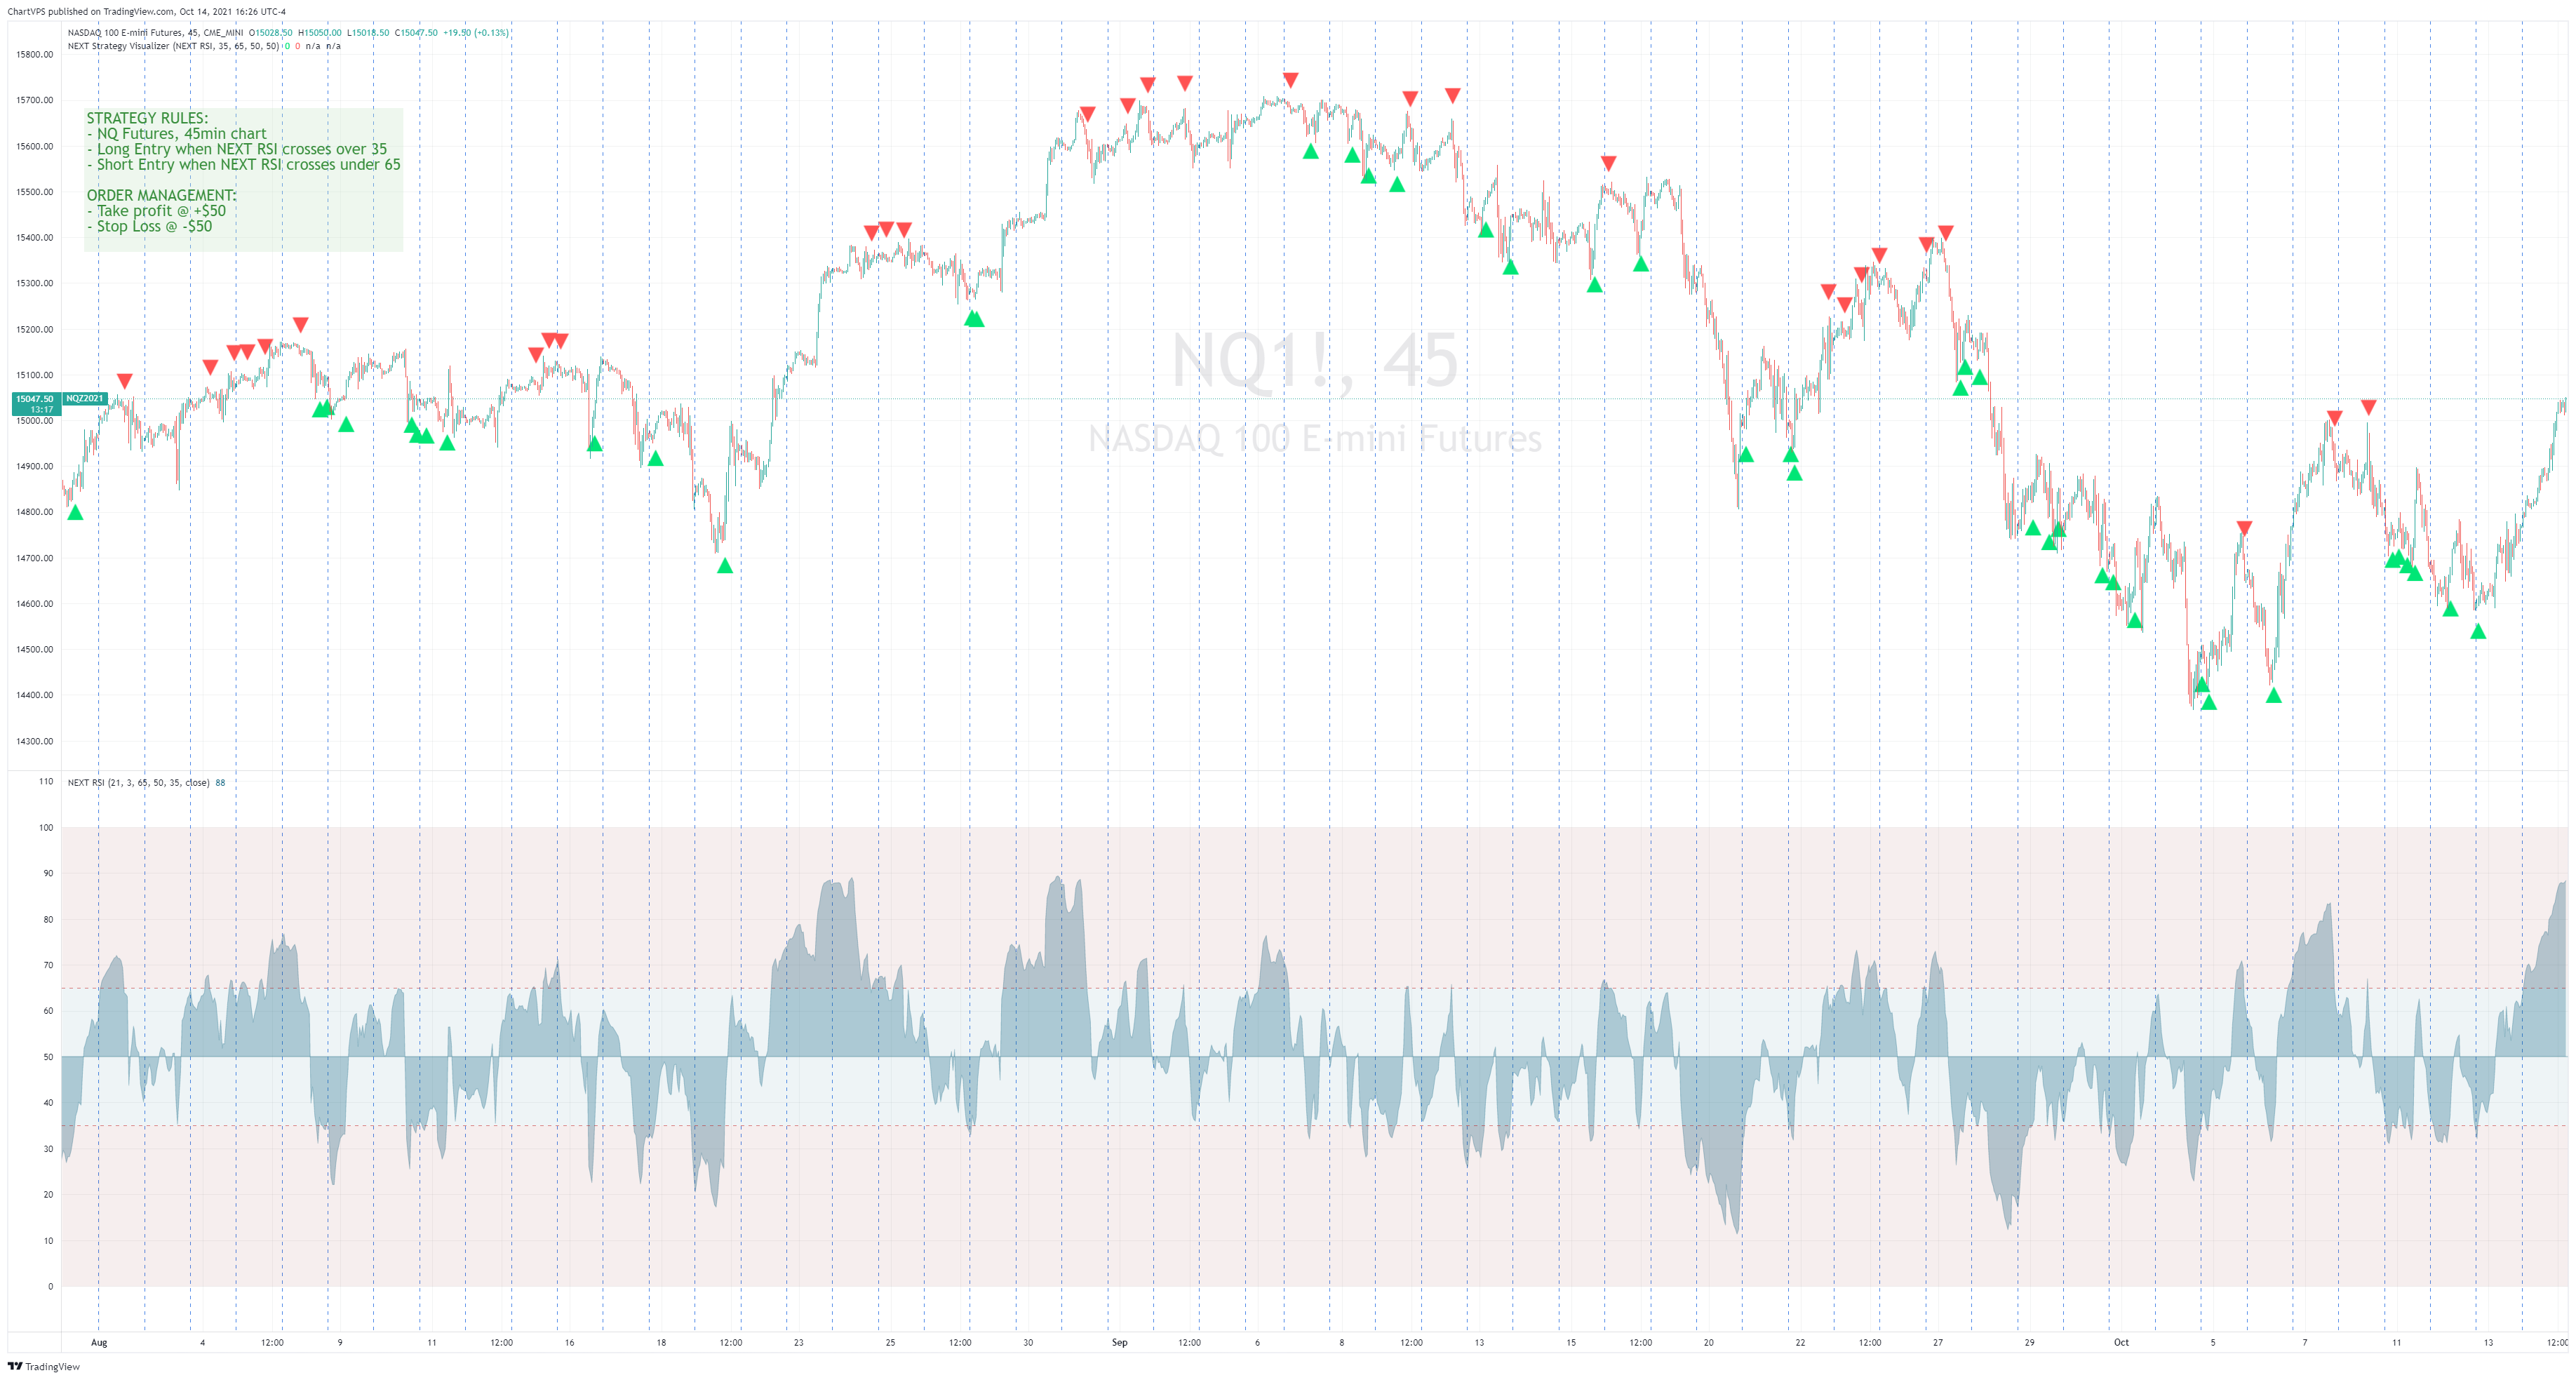
You can find the high-resolution, interactive version of the above chart on our TradingView Ideas page.
Strategy Rules
- NQ Futures, 45min chart
- Long Entry when NEXT RSI crosses over 35
- Short Entry when NEXT RSI crosses under 65
Order Management:
- Take profit @ +$50
- Stop Loss @ -$50
Prerequisites and set-up:
- NEXT RSI configured to 21,3,65,50,35
- NEXT Strategy Visualizer configured to Signal Source: NEXT RSI, LE @ 35, SE @ 65
Download
TradingView is our platform of choice for publication of the NEXT framework (indicators, strategies, etc.). The platform is free to use (Basic plan) with optional paid features, if you need them. You don’t for NEXT when using a single chart. Their fair approach to empowering retail traders aligns with ours. Trading should not be exclusive to hedge fund managers and professional traders. You can find all of our algo-driven software on the ChartVPS TradingView Scripts page. If you do decide to go with a paid version of TradingView (not required for ChartVPS NEXT), you can use this link to get up to $30 off.


